Fig. 2.
Download original image
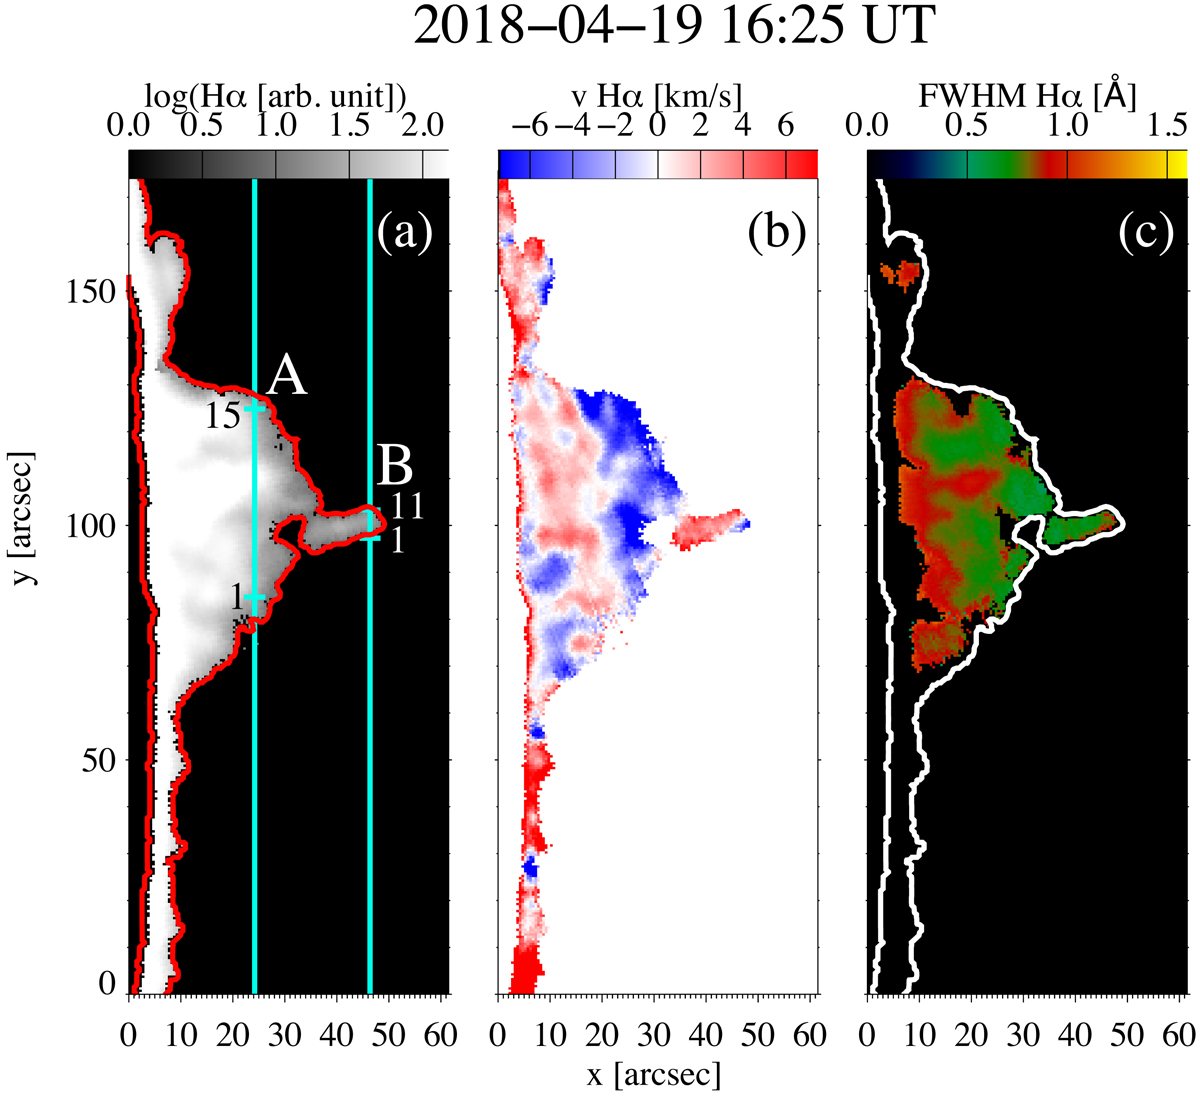
Prominence diagnostic based on the MSDP observation. (a) Hα intensity at the line centre, (b) Doppler velocity, and (c) FWHM. The contours present the Hα prominence defined as Mask-Hα (see Sect. 4.7). The blue vertical lines in panel a are the two selected slit positions (A, B) used to analyse the profiles (Figs. A.3 and A.5) and for plasma parameter diagnostics (Table 3). The small horizontal lines are the positions corresponding to profiles A1–A15 and B1–B11.
Current usage metrics show cumulative count of Article Views (full-text article views including HTML views, PDF and ePub downloads, according to the available data) and Abstracts Views on Vision4Press platform.
Data correspond to usage on the plateform after 2015. The current usage metrics is available 48-96 hours after online publication and is updated daily on week days.
Initial download of the metrics may take a while.