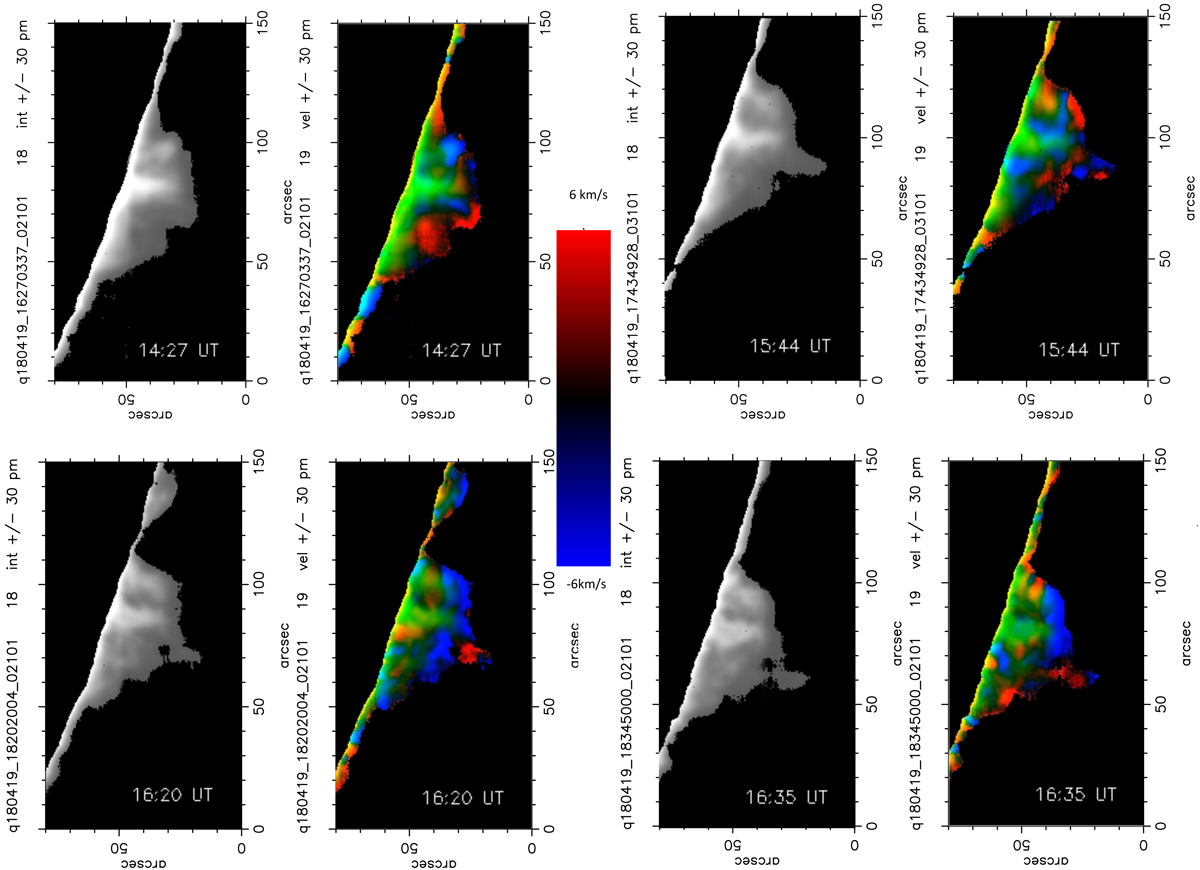
Fig. A.1.
Download original image
MSDP Dopplergrams for different times: intensity and Doppler shifts at Hα ± 0.3 Å. Blue and red represent blueshift and redshift, respectively. Yellow and green represent the intensity. The title on the left of each image indicates the local time (CET) in Meudon. The UT time is indicated in the intensity and Doppler-shift maps.
Current usage metrics show cumulative count of Article Views (full-text article views including HTML views, PDF and ePub downloads, according to the available data) and Abstracts Views on Vision4Press platform.
Data correspond to usage on the plateform after 2015. The current usage metrics is available 48-96 hours after online publication and is updated daily on week days.
Initial download of the metrics may take a while.