Fig. 12.
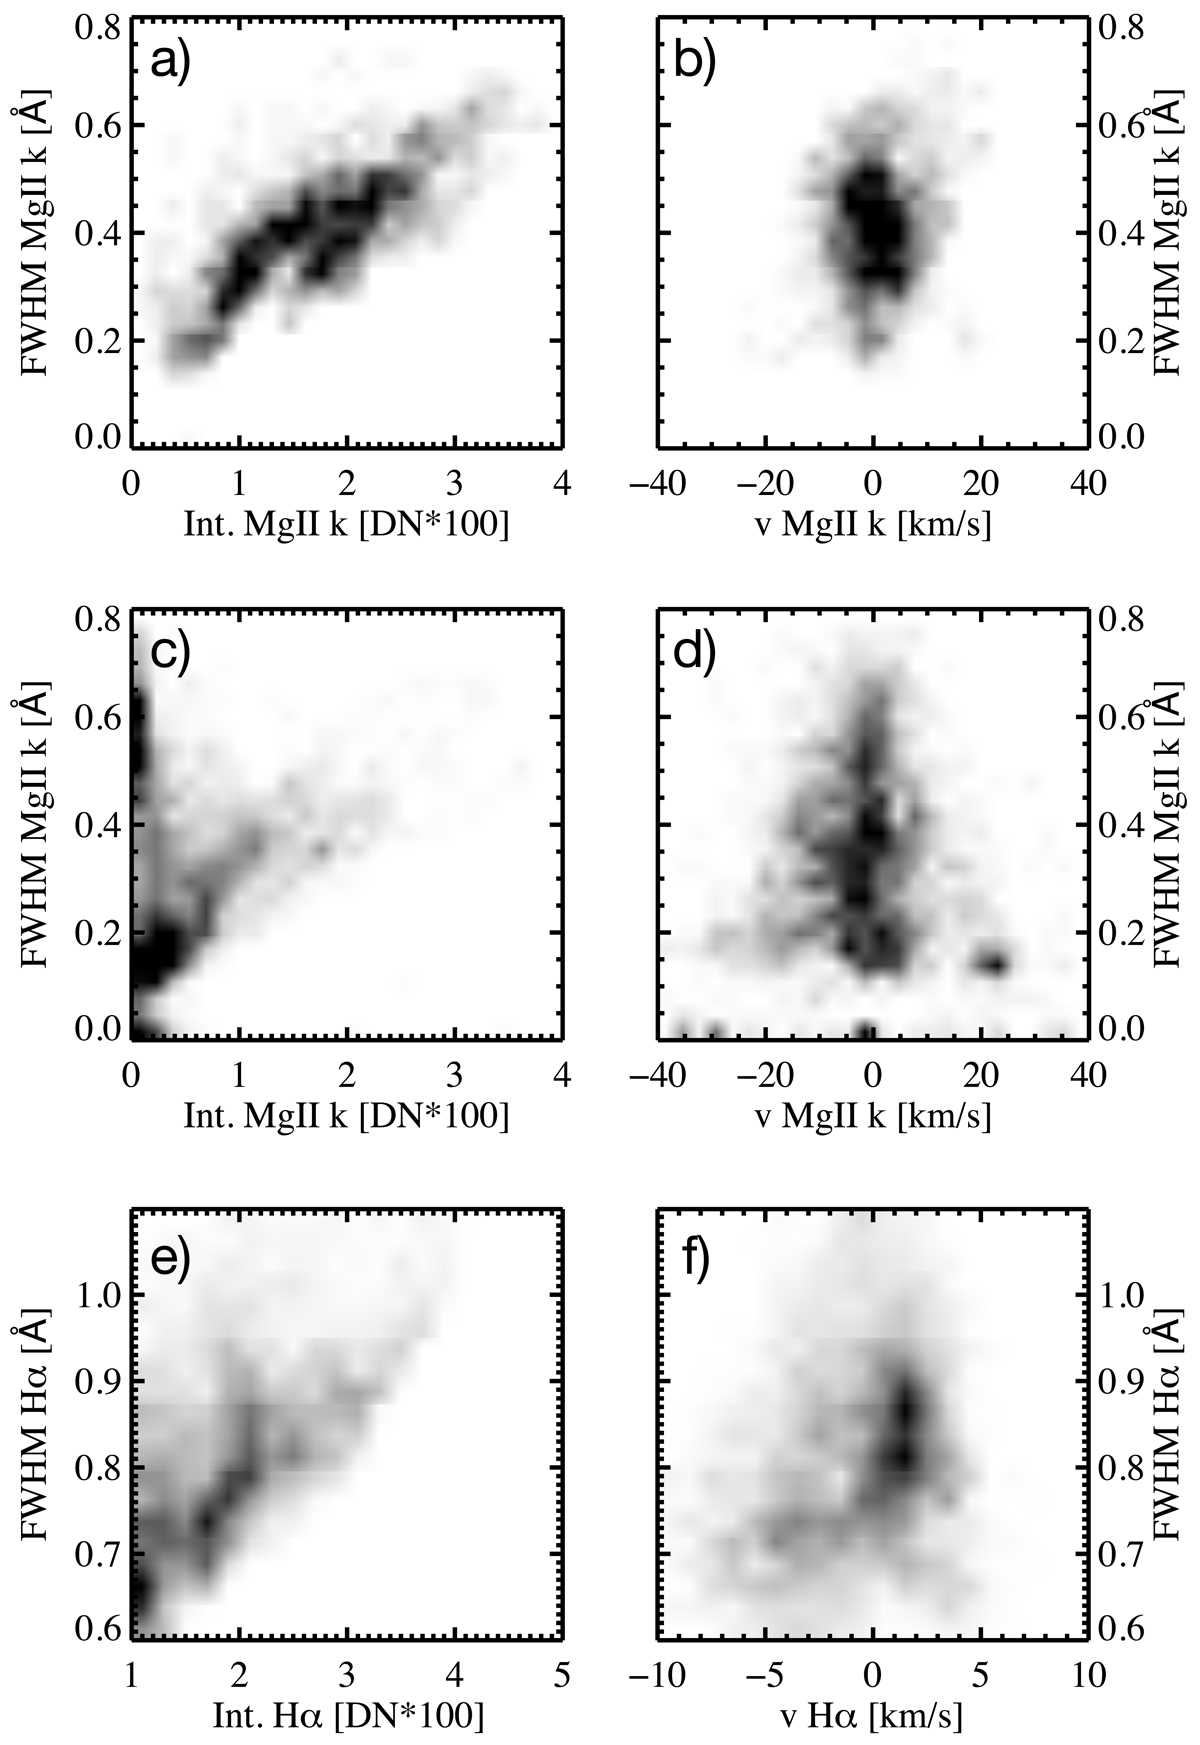
Download original image
Probability density functions (PDFs) for Mg II k line parameters for the area between the limb and the outer edge of the Hα prominence contour, y-range from 60 to 137 arc in Fig. 8: (a) intensity versus FWHM, (b) Doppler velocity versus FWHM; outside of the Hα contour, (c) intensity versus FWHM, (d) Doppler velocity versus FWHM; PDFs for Hα line parameters, (e) intensity versus FWHM, and (f) Doppler velocity versus FWHM. The PDF values are plotted in linear scale.
Current usage metrics show cumulative count of Article Views (full-text article views including HTML views, PDF and ePub downloads, according to the available data) and Abstracts Views on Vision4Press platform.
Data correspond to usage on the plateform after 2015. The current usage metrics is available 48-96 hours after online publication and is updated daily on week days.
Initial download of the metrics may take a while.