Free Access
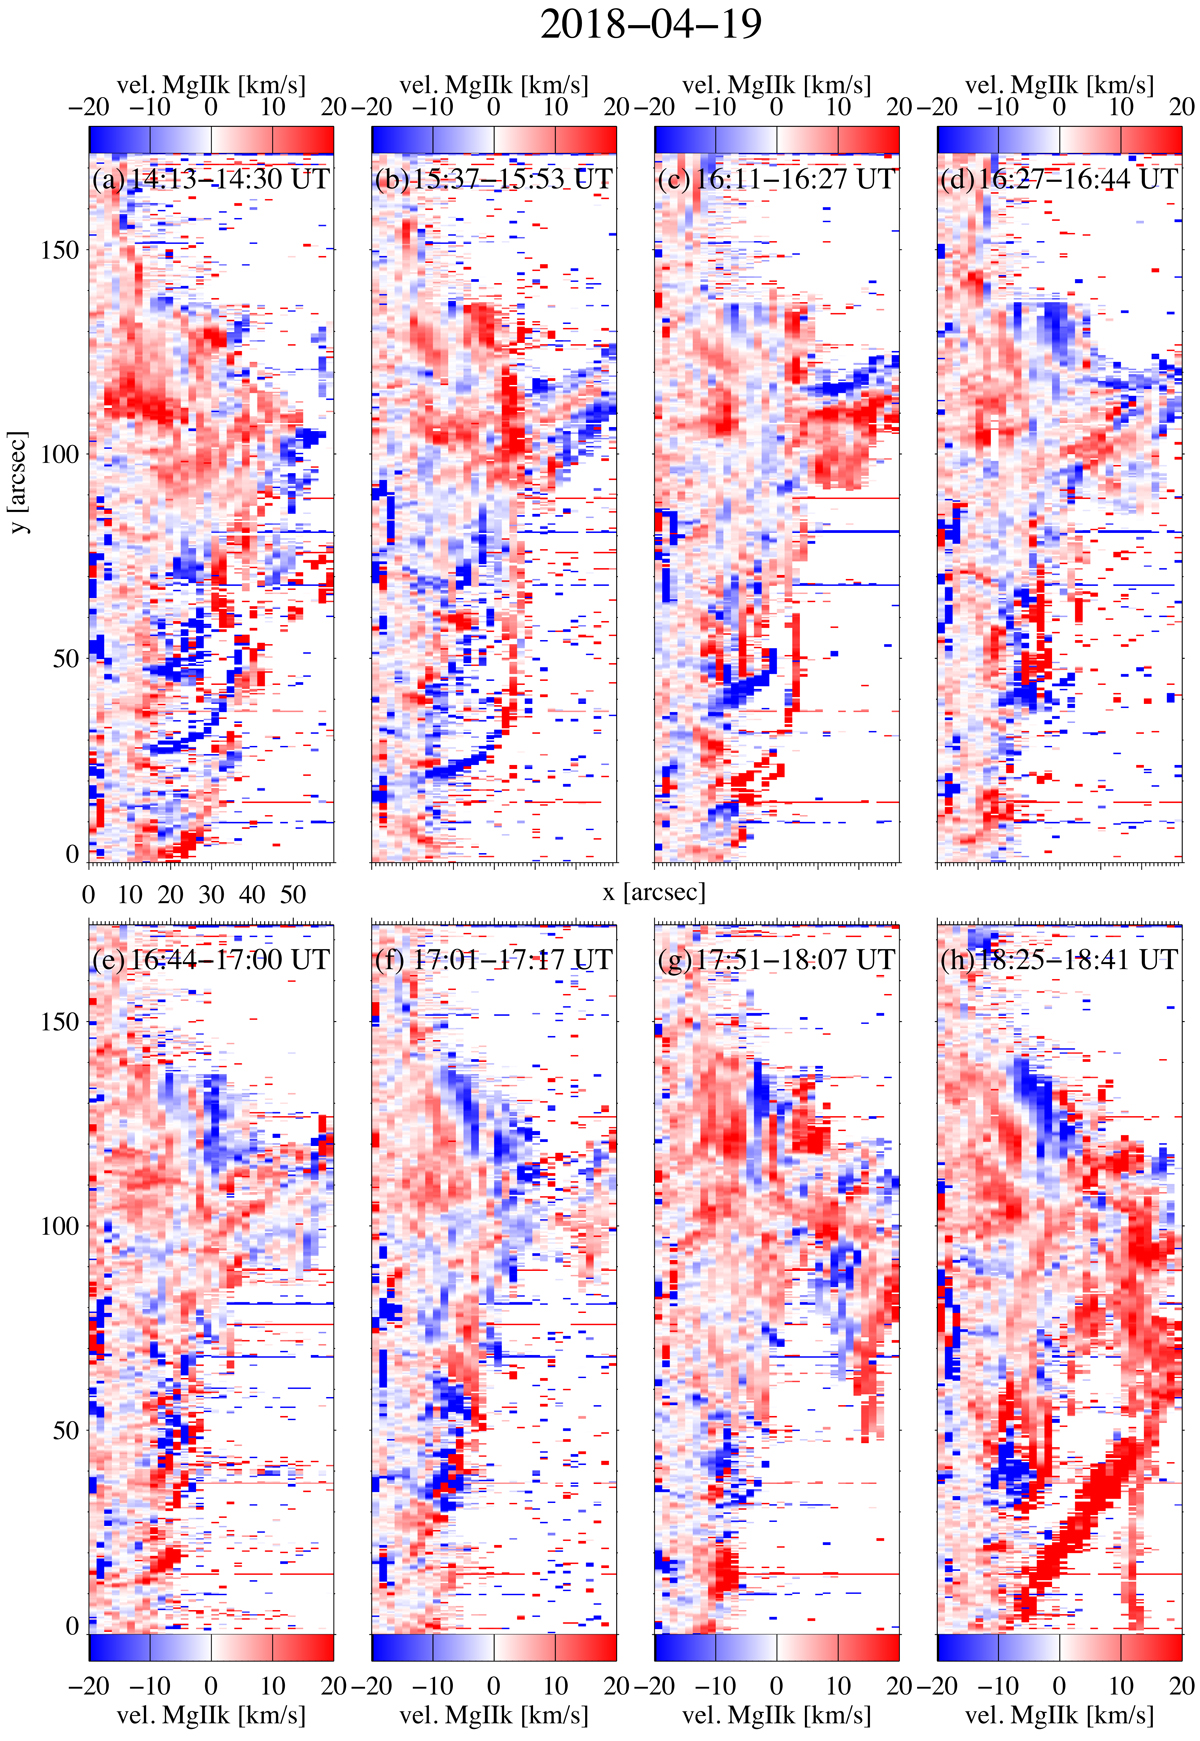
Fig. 11.
Download original image
Doppler velocity maps (Gaussian fitting) in Mg II k line computed from the spectra of the rasters observed by IRIS between 14:15 UT to 18:41 UT (rasters 1, 5, 7, 8, 9, 10, 13, 17). The temporal evolution is available as an online movie (Movie5).
Current usage metrics show cumulative count of Article Views (full-text article views including HTML views, PDF and ePub downloads, according to the available data) and Abstracts Views on Vision4Press platform.
Data correspond to usage on the plateform after 2015. The current usage metrics is available 48-96 hours after online publication and is updated daily on week days.
Initial download of the metrics may take a while.