Free Access
Fig. 10.
Download original image
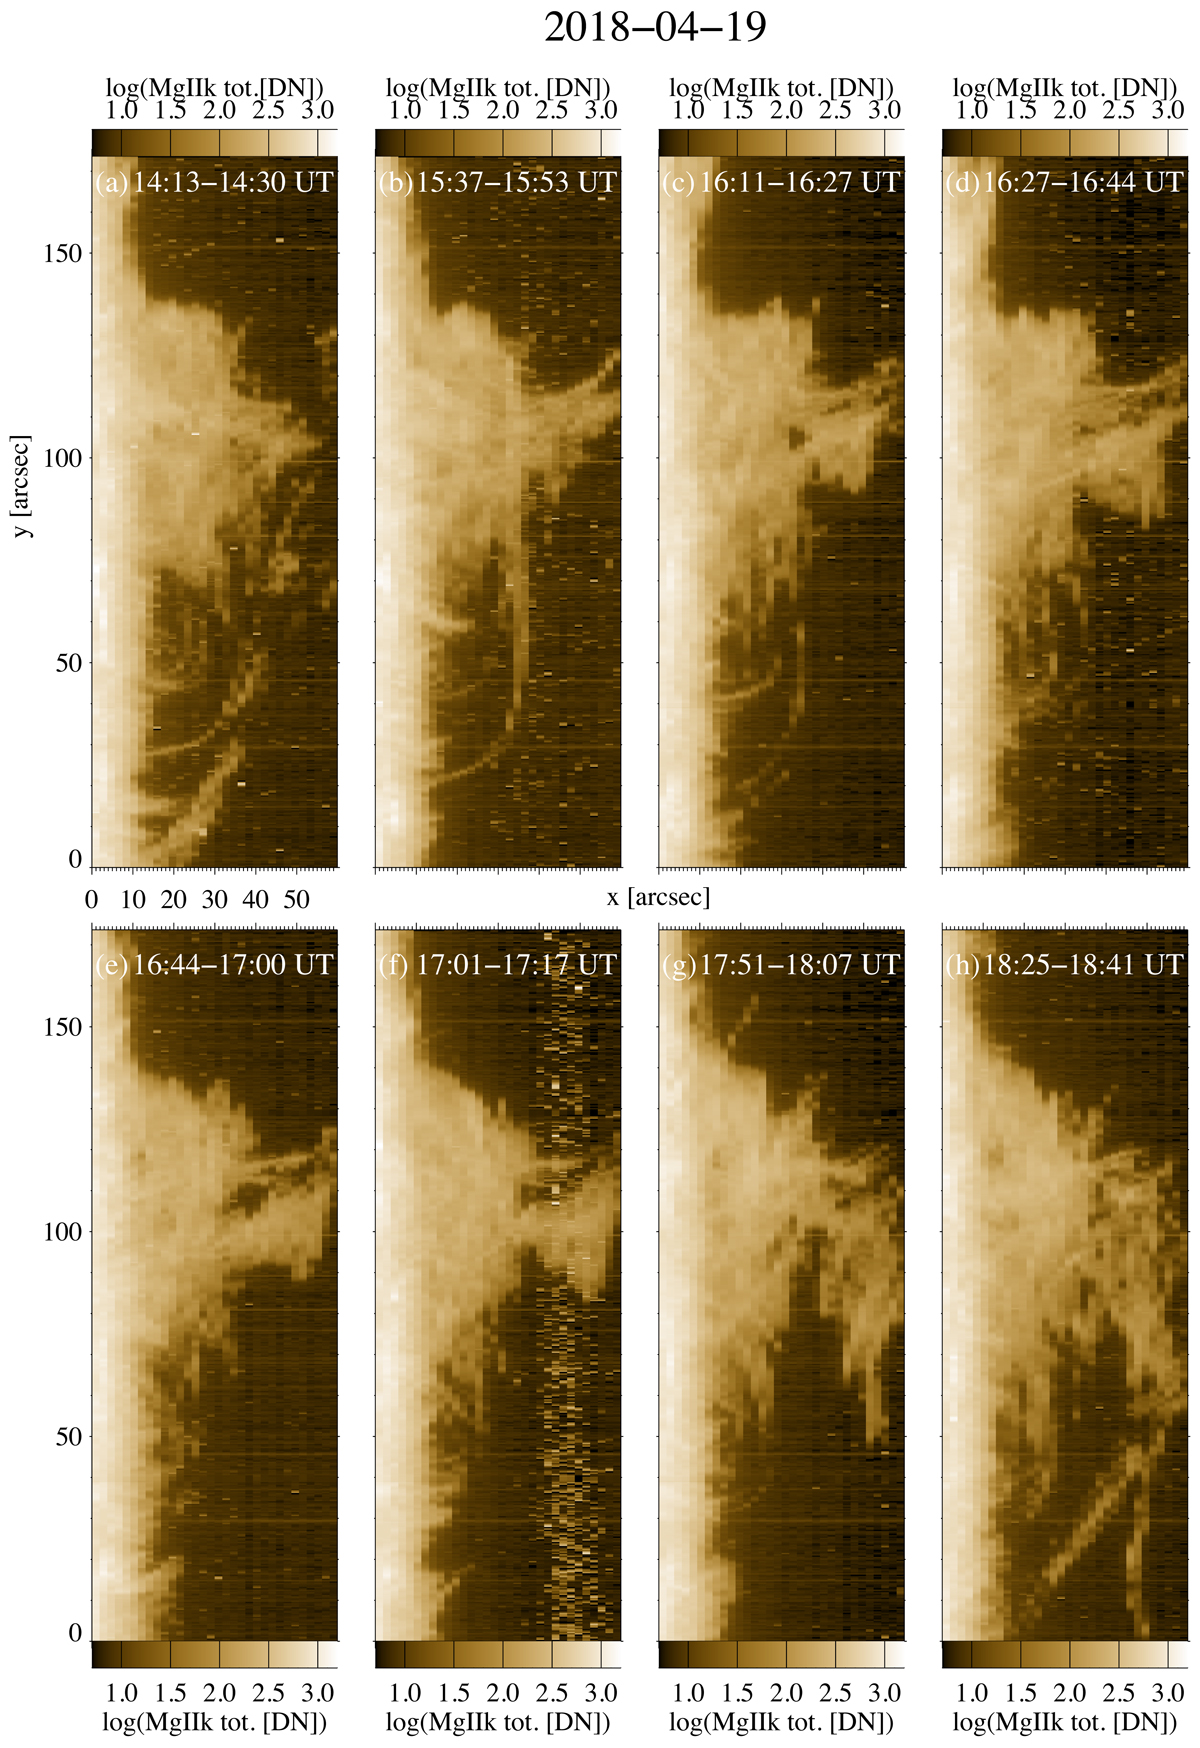
Sample of integrated intensity maps in Mg II k line, each map being reconstructed from the 32 spectra of one raster, showing the evolution of the tornado at the top and the long loops connecting with the limb between 14:15 UT and 18:41 UT (rasters 1, 5, 7, 8, 9, 10, 13, and 17).
Current usage metrics show cumulative count of Article Views (full-text article views including HTML views, PDF and ePub downloads, according to the available data) and Abstracts Views on Vision4Press platform.
Data correspond to usage on the plateform after 2015. The current usage metrics is available 48-96 hours after online publication and is updated daily on week days.
Initial download of the metrics may take a while.