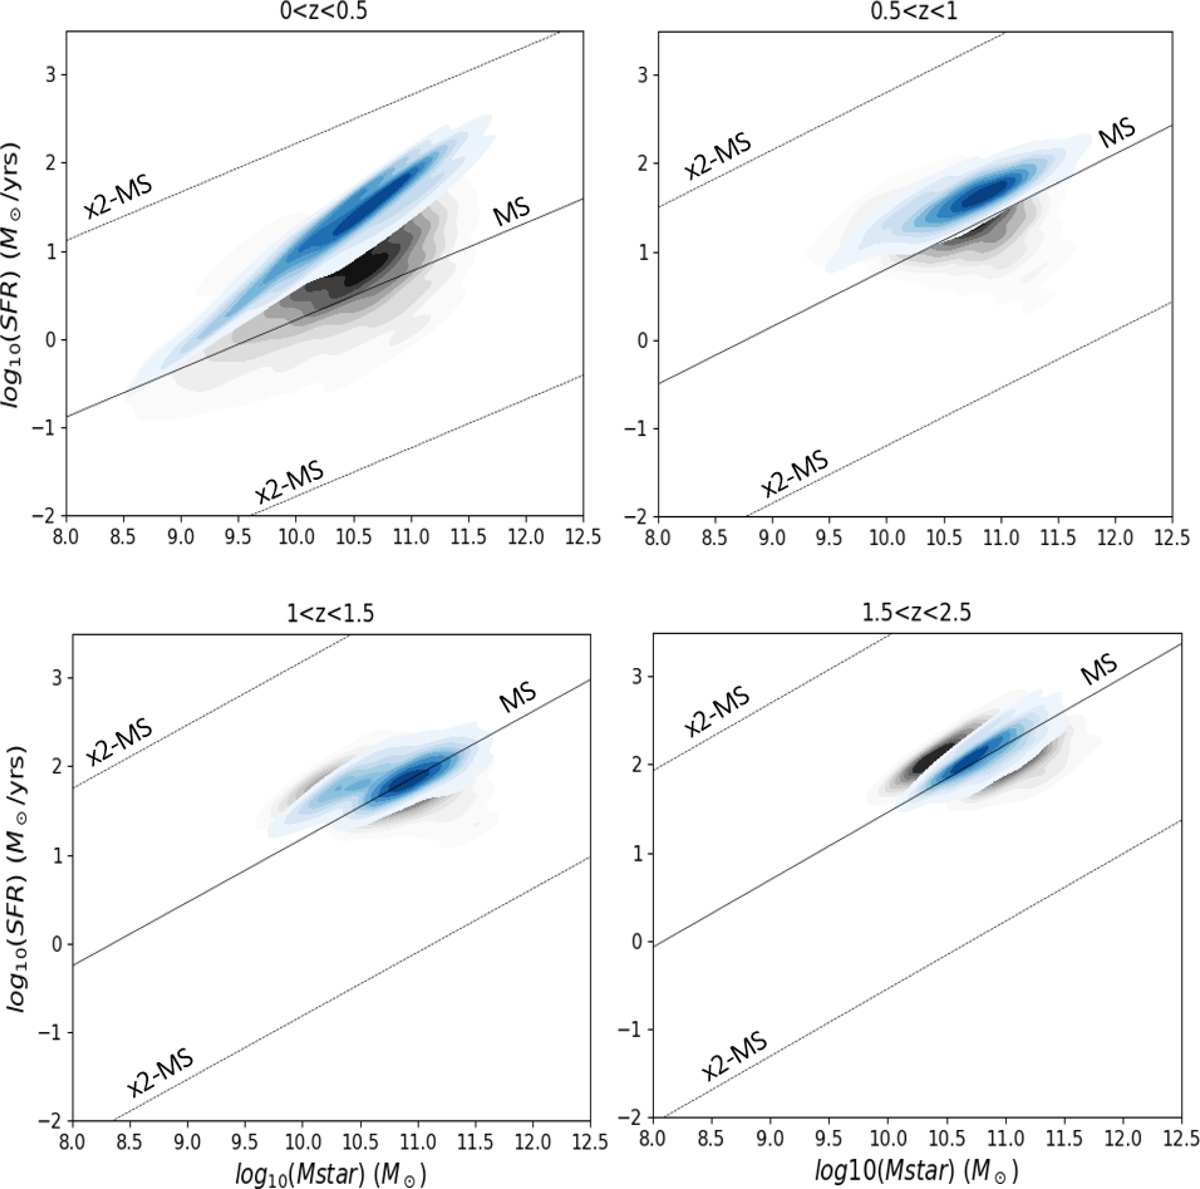
Fig. 6.
Download original image
Main-sequence (SFR vs. Mstar) relation for the ELAIS N1 and COSMOS fields in four redshift bins. In blue we show the LSST-like sample, and in black the real sample. The solid black line represents the MS by Speagle et al. (2014), and the dashed lines mark the loci two times above and below the MS. This plot shows a clear SFR overestimate obtained using LSST bands alone, which tends to disappear at higher redshift ranges.
Current usage metrics show cumulative count of Article Views (full-text article views including HTML views, PDF and ePub downloads, according to the available data) and Abstracts Views on Vision4Press platform.
Data correspond to usage on the plateform after 2015. The current usage metrics is available 48-96 hours after online publication and is updated daily on week days.
Initial download of the metrics may take a while.