Fig. 5.
Download original image
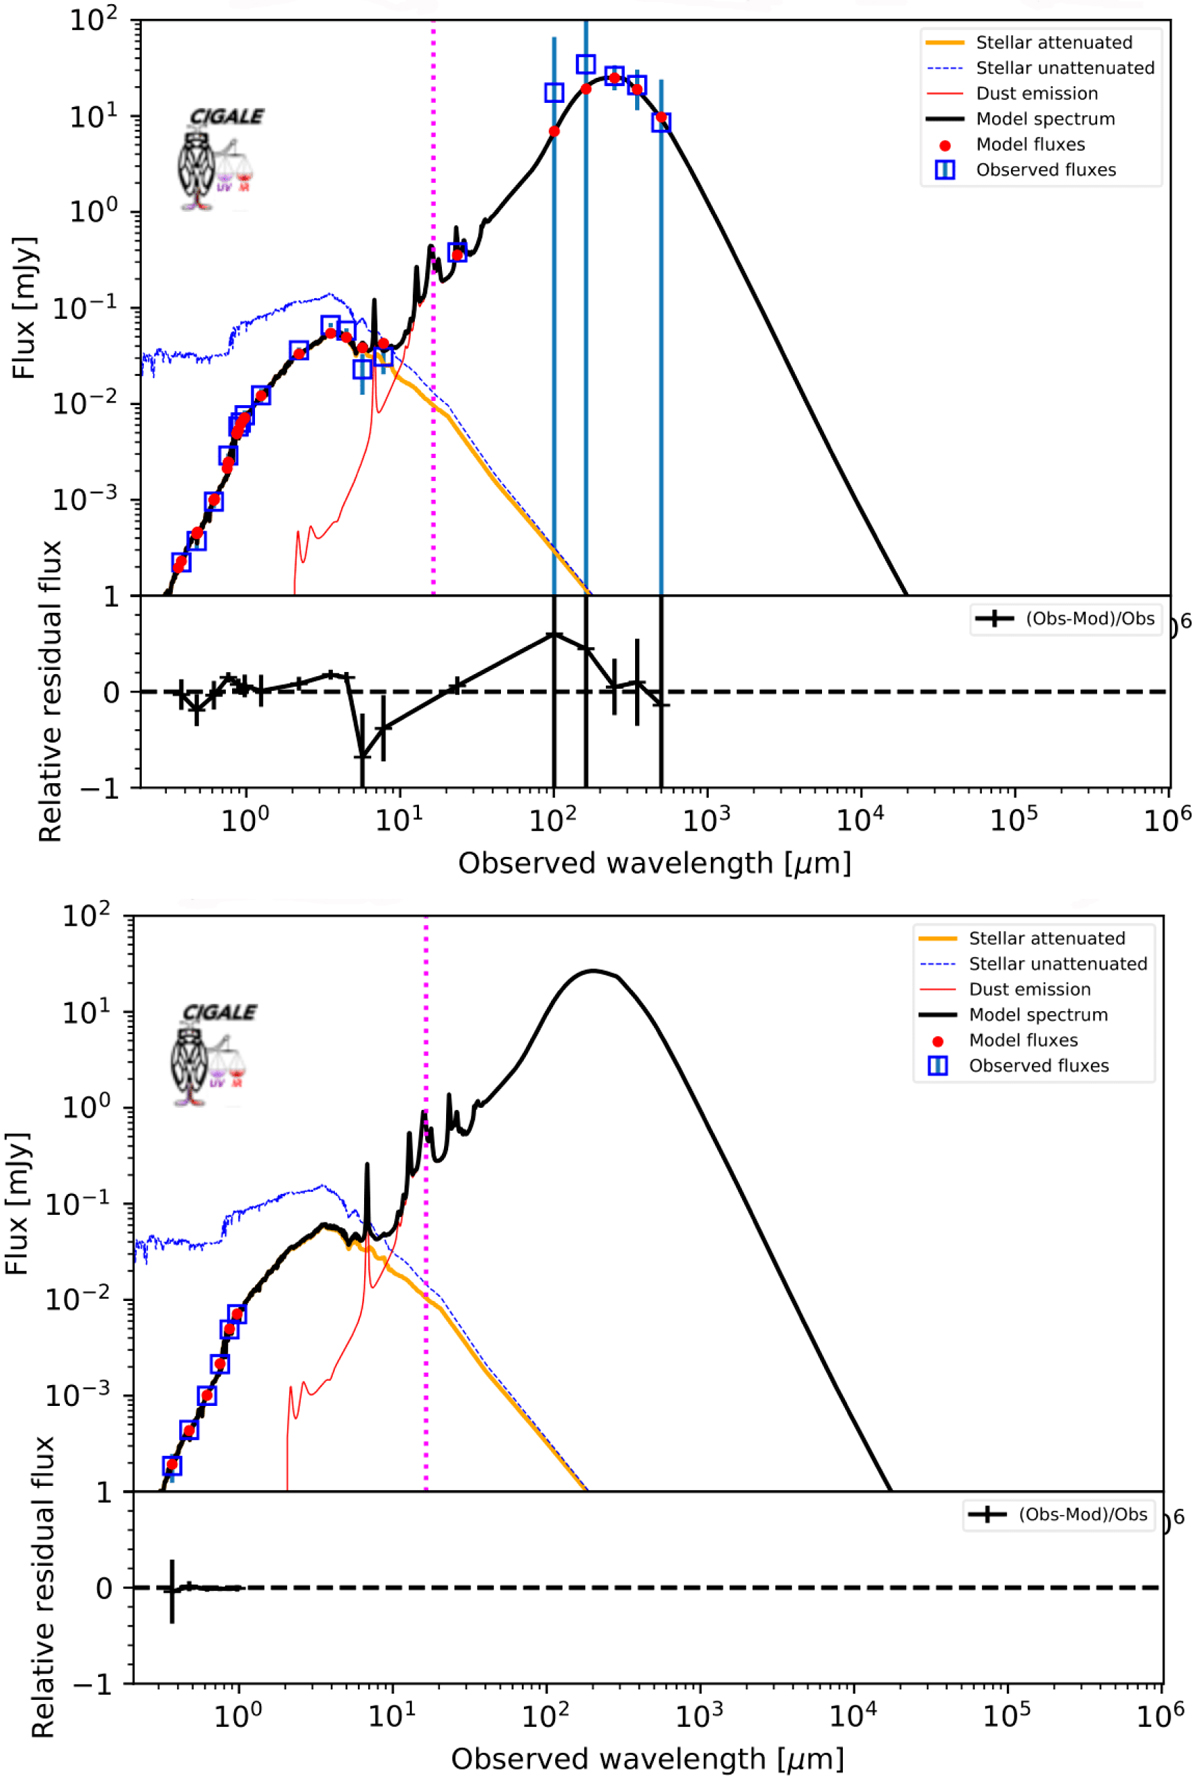
Comparison of SEDs evaluated for the same object at z ∼ 1 using the full UV-to-IR observations (upper panel) and the LSST optical bands alone (bottom panel). The blue square represents the observed fluxes, and red dots represent the fluxes predicted by the model. The magenta lines delimit the division between optical and IR bands, which is taken into account by CIGALE. The IR emission is not constrained for the LSST estimate.
Current usage metrics show cumulative count of Article Views (full-text article views including HTML views, PDF and ePub downloads, according to the available data) and Abstracts Views on Vision4Press platform.
Data correspond to usage on the plateform after 2015. The current usage metrics is available 48-96 hours after online publication and is updated daily on week days.
Initial download of the metrics may take a while.