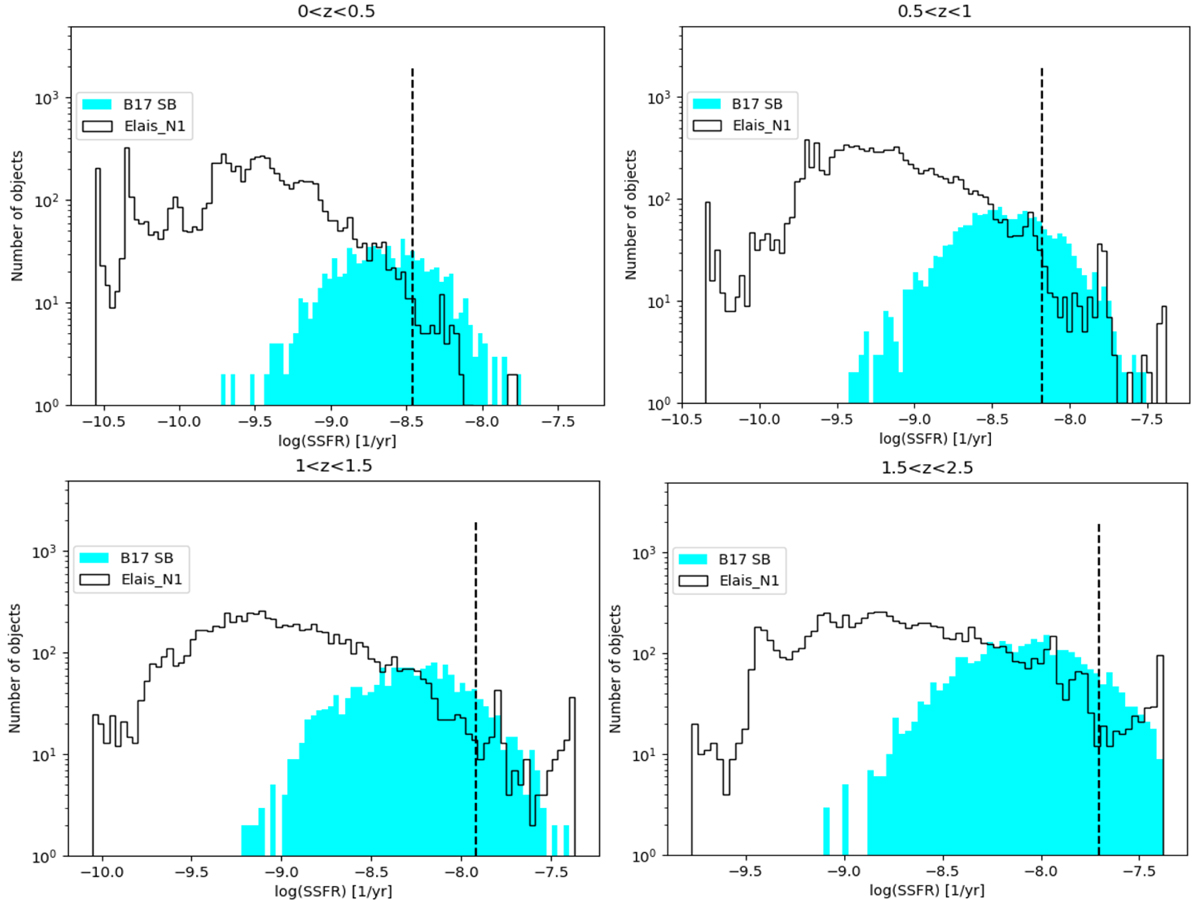
Fig. 2.
Download original image
sSFR distribution in four different redshift bins obtained with delayed SFH plus an additional burst. Open histograms are the galaxy distributions (MS+SB) derived in this work, the dashed black line is the division between SBs (right side of the line) and MS (left side of the line) in our sample, and the cyan full histograms represent the simulated SB sample from B17. The division is located at about 3σ from the Gaussian centre. The sample is the same as for Fig. 1, but the binning is different.
Current usage metrics show cumulative count of Article Views (full-text article views including HTML views, PDF and ePub downloads, according to the available data) and Abstracts Views on Vision4Press platform.
Data correspond to usage on the plateform after 2015. The current usage metrics is available 48-96 hours after online publication and is updated daily on week days.
Initial download of the metrics may take a while.