Fig. 1.
Download original image
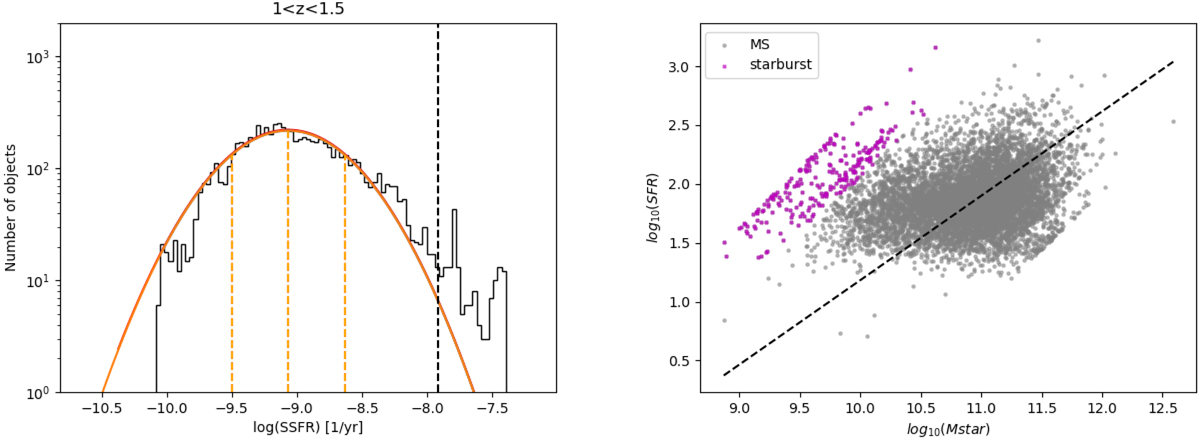
Left panel: example of the sSFR distribution of ELAIS N1 galaxies in the redshift range 1 < z < 1.5 obtained with the delayed SFH plus an additional burst. The orange line respresents the Gaussian fit, and the dashed black line corresponds to the division of starburst (SB galaxies are located on the right side of the line) and MS galaxies. The division is located 3σ away from the centre of the Gaussian. Right panel: MS distribution for the same redshift bin. Magenta circles represent SB galaxies selected from the sSFR distribution shown in the left panel. The dashed black line represents the Speagle et al. (2014) MS.
Current usage metrics show cumulative count of Article Views (full-text article views including HTML views, PDF and ePub downloads, according to the available data) and Abstracts Views on Vision4Press platform.
Data correspond to usage on the plateform after 2015. The current usage metrics is available 48-96 hours after online publication and is updated daily on week days.
Initial download of the metrics may take a while.