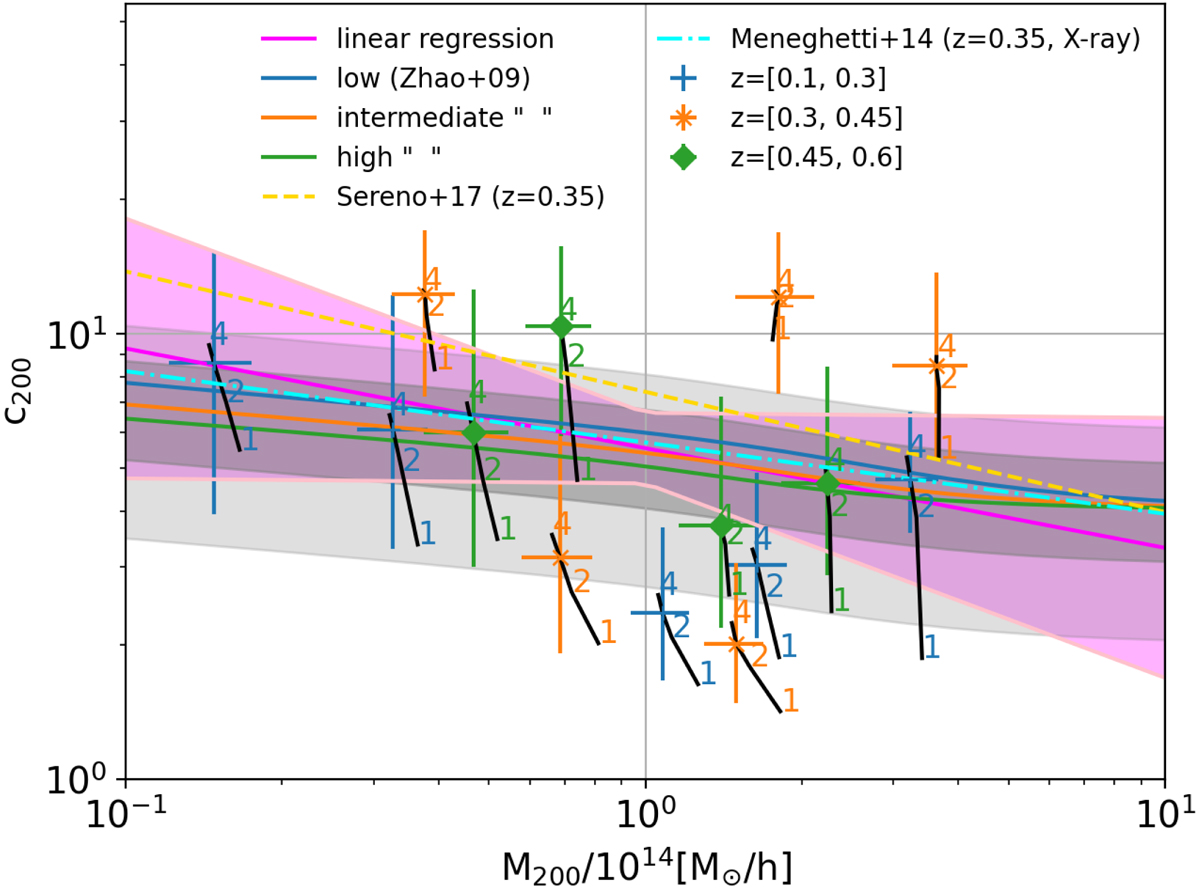
Fig. 8.
Download original image
Concentration-mass relation obtained from our stacked weak lensing analysis of the AMICO-KiDS-DR3 clusters. Data points and error bars show the median and the 18th−82th percentiles of the posteriors distributions. Blue, orange and green colours refer to the low, intermediate and high redshift cluster sub-samples. The solid curves represent the predictions by Zhao et al. (2009) in three redshift intervals. For each data point, the numbers show the results for the c − M relation obtained adopting the truncation radius rt equal to 1, 2 and 4 – in unit of R200, respectively. The grey and light-grey shaded regions indicate 1 and 2-σln c = 0.25 scatter as measured in numerical simulations (Dolag et al. 2004; Giocoli et al. 2012a). The magenta line show the linear regression in the c − m relation computed using our reference results as dataset, while the shaded light-magenta region encloses the 1-σ uncertainties in both the slope and the intercept of the relation. In this case, we use the ODR routine in python considering the uncertainties in both mass and concentration. Dashed gold and dash-dotted cyan display the results by Sereno et al. (2017) – based on observational data – and Meneghetti et al. (2014) – on hydrodynamical simulations, respectively.
Current usage metrics show cumulative count of Article Views (full-text article views including HTML views, PDF and ePub downloads, according to the available data) and Abstracts Views on Vision4Press platform.
Data correspond to usage on the plateform after 2015. The current usage metrics is available 48-96 hours after online publication and is updated daily on week days.
Initial download of the metrics may take a while.