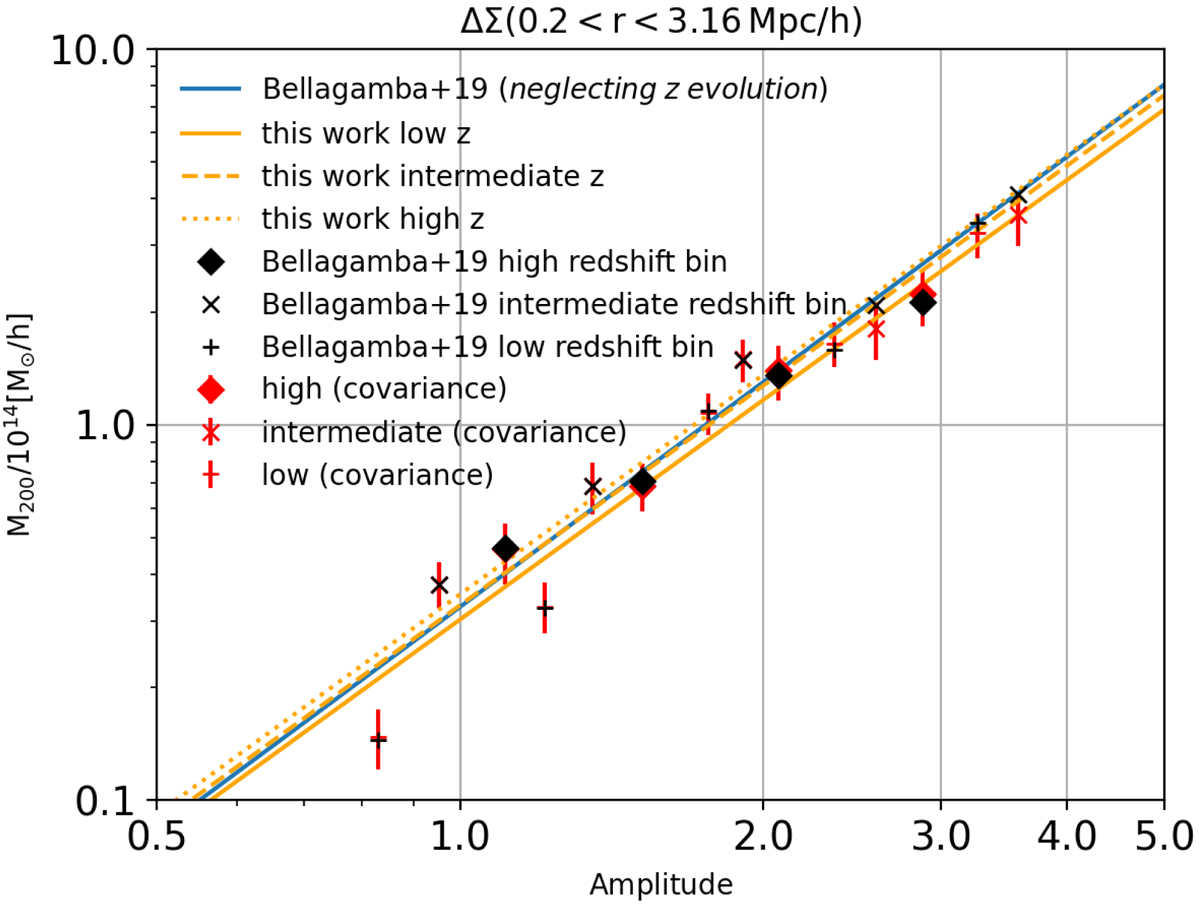
Fig. 6.
Download original image
Mass-amplitude relation obtained in the ∼1h case, accounting for the full covariance in each amplitude and redshift interval. We compare our results (red data points) with those by Bellagamba et al. (2019) (black data points). The error bars show the 18th and 82nd percentiles of the posterior distributions. The blue solid line shows the scaling relation recovered by Bellagamba et al. (2019); the orange solid line exhibits our best-fit result.
Current usage metrics show cumulative count of Article Views (full-text article views including HTML views, PDF and ePub downloads, according to the available data) and Abstracts Views on Vision4Press platform.
Data correspond to usage on the plateform after 2015. The current usage metrics is available 48-96 hours after online publication and is updated daily on week days.
Initial download of the metrics may take a while.