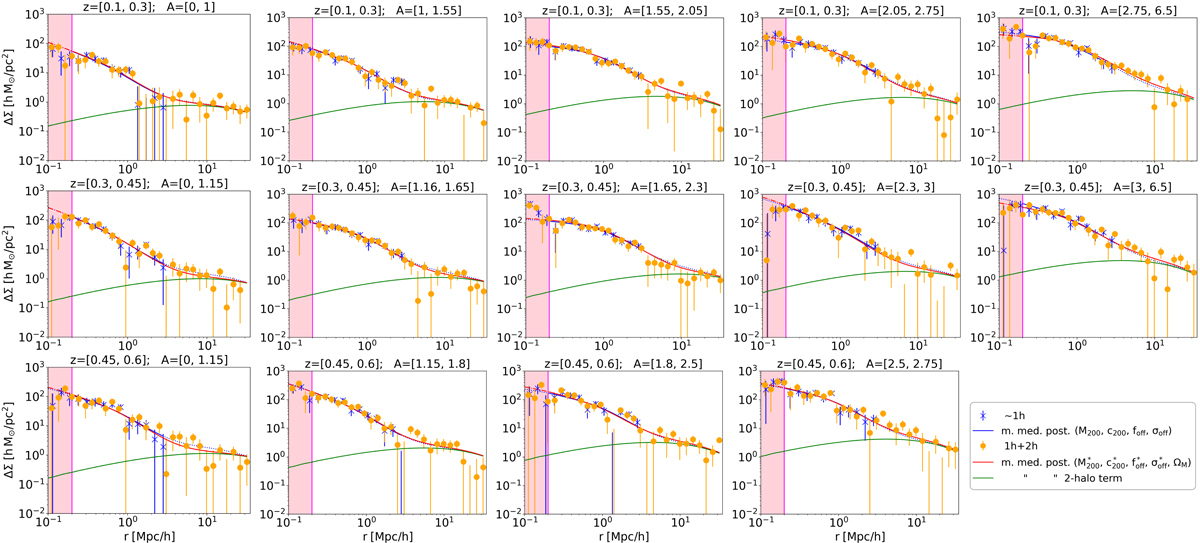
Fig. 5.
Download original image
Stacked excess surface mass density profiles of the clusters divided in different amplitude bins (from left to right) and redshift bins (from top to bottom). The blue and orange data points refer to the ∼1h and 1h + 2h cases, respectively. The corresponding error bars represent the square root of the diagonal terms in the corresponding covariance matrix. The blue and red solid curves show the best-fit models, which are the median values of the posterior distributions assessed with the MCMC, corresponding to the ∼1h and 1h + 2h cases, respectively. The blue and red curves are respectively dotted and dashed outside the corresponding dataset, especially the blue line below 0.2 and above 3.16 Mpc h−1, and the red line only below 0.2 Mpc h−1. The green curves show the two-halo term contribution.
Current usage metrics show cumulative count of Article Views (full-text article views including HTML views, PDF and ePub downloads, according to the available data) and Abstracts Views on Vision4Press platform.
Data correspond to usage on the plateform after 2015. The current usage metrics is available 48-96 hours after online publication and is updated daily on week days.
Initial download of the metrics may take a while.