Fig. 4.
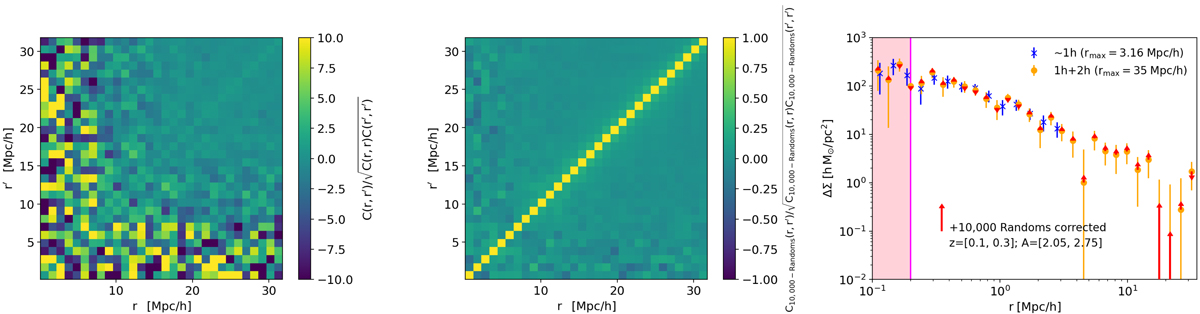
Download original image
Example of covariances and differencial surface density profiles. Left panel: normalised covariance of the dataset corresponding to the bin with 0.1 ≤ z < 0.3 and 2.05 ≤ A < 2.75, stacking 96 detected clusters, computed with 10 000 bootstrap realisations of the stacked profile. Central panel: normalised covariance of the 10 000 realisations of the whole AMICO sample, randomly distributed in the survey footprints. Right panel: stacked excess surface mass density profile of the 1h case (blue crosses) and 1h + 2h case (orange circles). In both cases we subtract to the data points the stacked profiles around random centre. The error bars refer to the square root of the diagonal elements of the final covariance (Eq. (17)). The red arrows indicate the variation of the stacked profile when, for the corresponding redshift bin, the random contributions are subtracted from the data. The blue crosses and orange filled circles refer to two different binning schemes, giving the possibility to constrain the cluster-halo structural properties and the large-scale matter density distribution in which the clusters are located, respectively.
Current usage metrics show cumulative count of Article Views (full-text article views including HTML views, PDF and ePub downloads, according to the available data) and Abstracts Views on Vision4Press platform.
Data correspond to usage on the plateform after 2015. The current usage metrics is available 48-96 hours after online publication and is updated daily on week days.
Initial download of the metrics may take a while.