Fig. 3.
Download original image
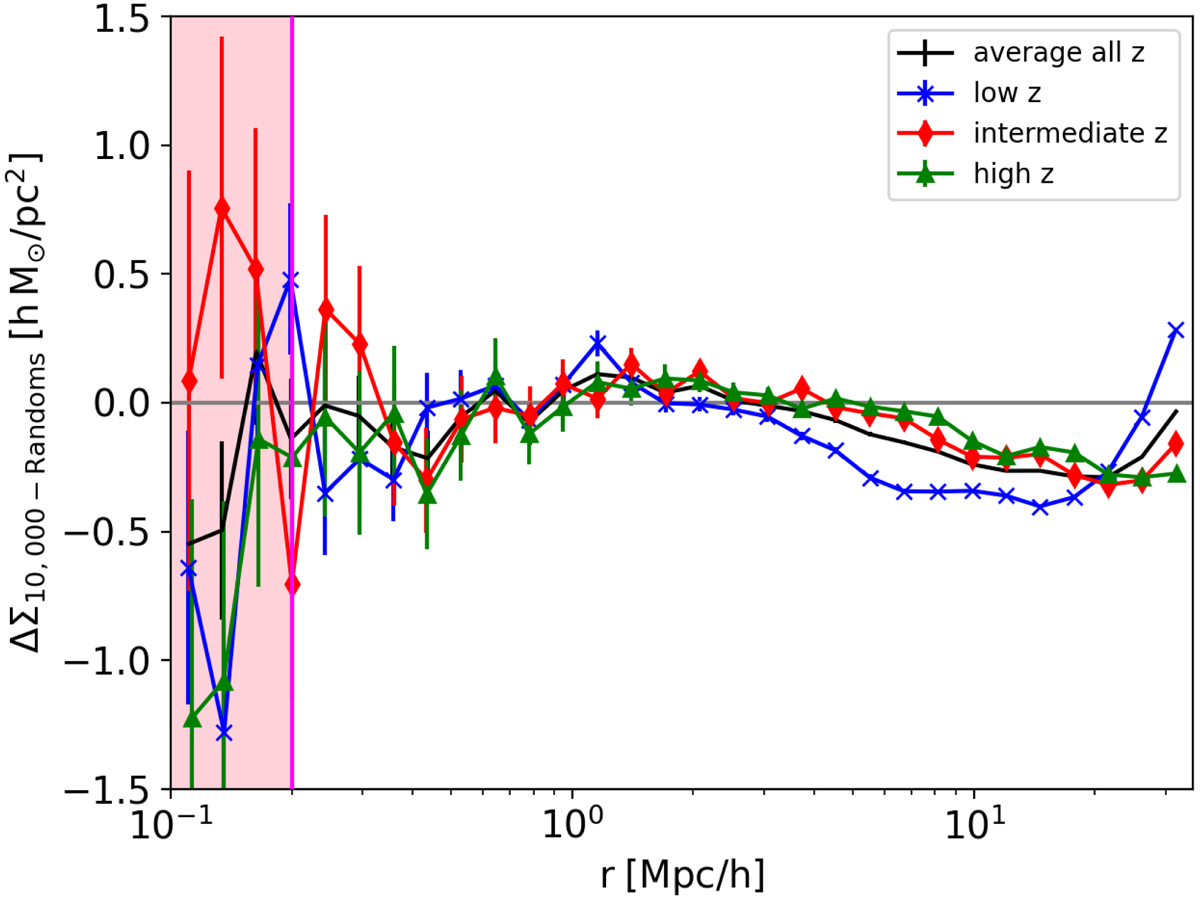
Excess of surface mass density profile around random centres for the three redshift bins into which the AMICO clusters have been divided: low (0.1 ≤ z < 0.3), intermediate (0.3 ≤ z < 0.45), and high (0.45 ≤ z ≤ 0.6) redshift. We created 10 000 realisations of the sample using random centres. The blue crosses, red diamonds, and green triangles show the average measurements in the three redshift intervals, extending the profiles up to 35 Mpc h−1 as in the 1h + 2h case. The black line displays the average over all redshifts. The error bars show square root of the diagonal terms of the corresponding covariances CRandoms(r, r′). The vertical pink area on the left gives the data points below 0.2 Mpc h−1, which we do not consider in our analysis.
Current usage metrics show cumulative count of Article Views (full-text article views including HTML views, PDF and ePub downloads, according to the available data) and Abstracts Views on Vision4Press platform.
Data correspond to usage on the plateform after 2015. The current usage metrics is available 48-96 hours after online publication and is updated daily on week days.
Initial download of the metrics may take a while.