Fig. 2.
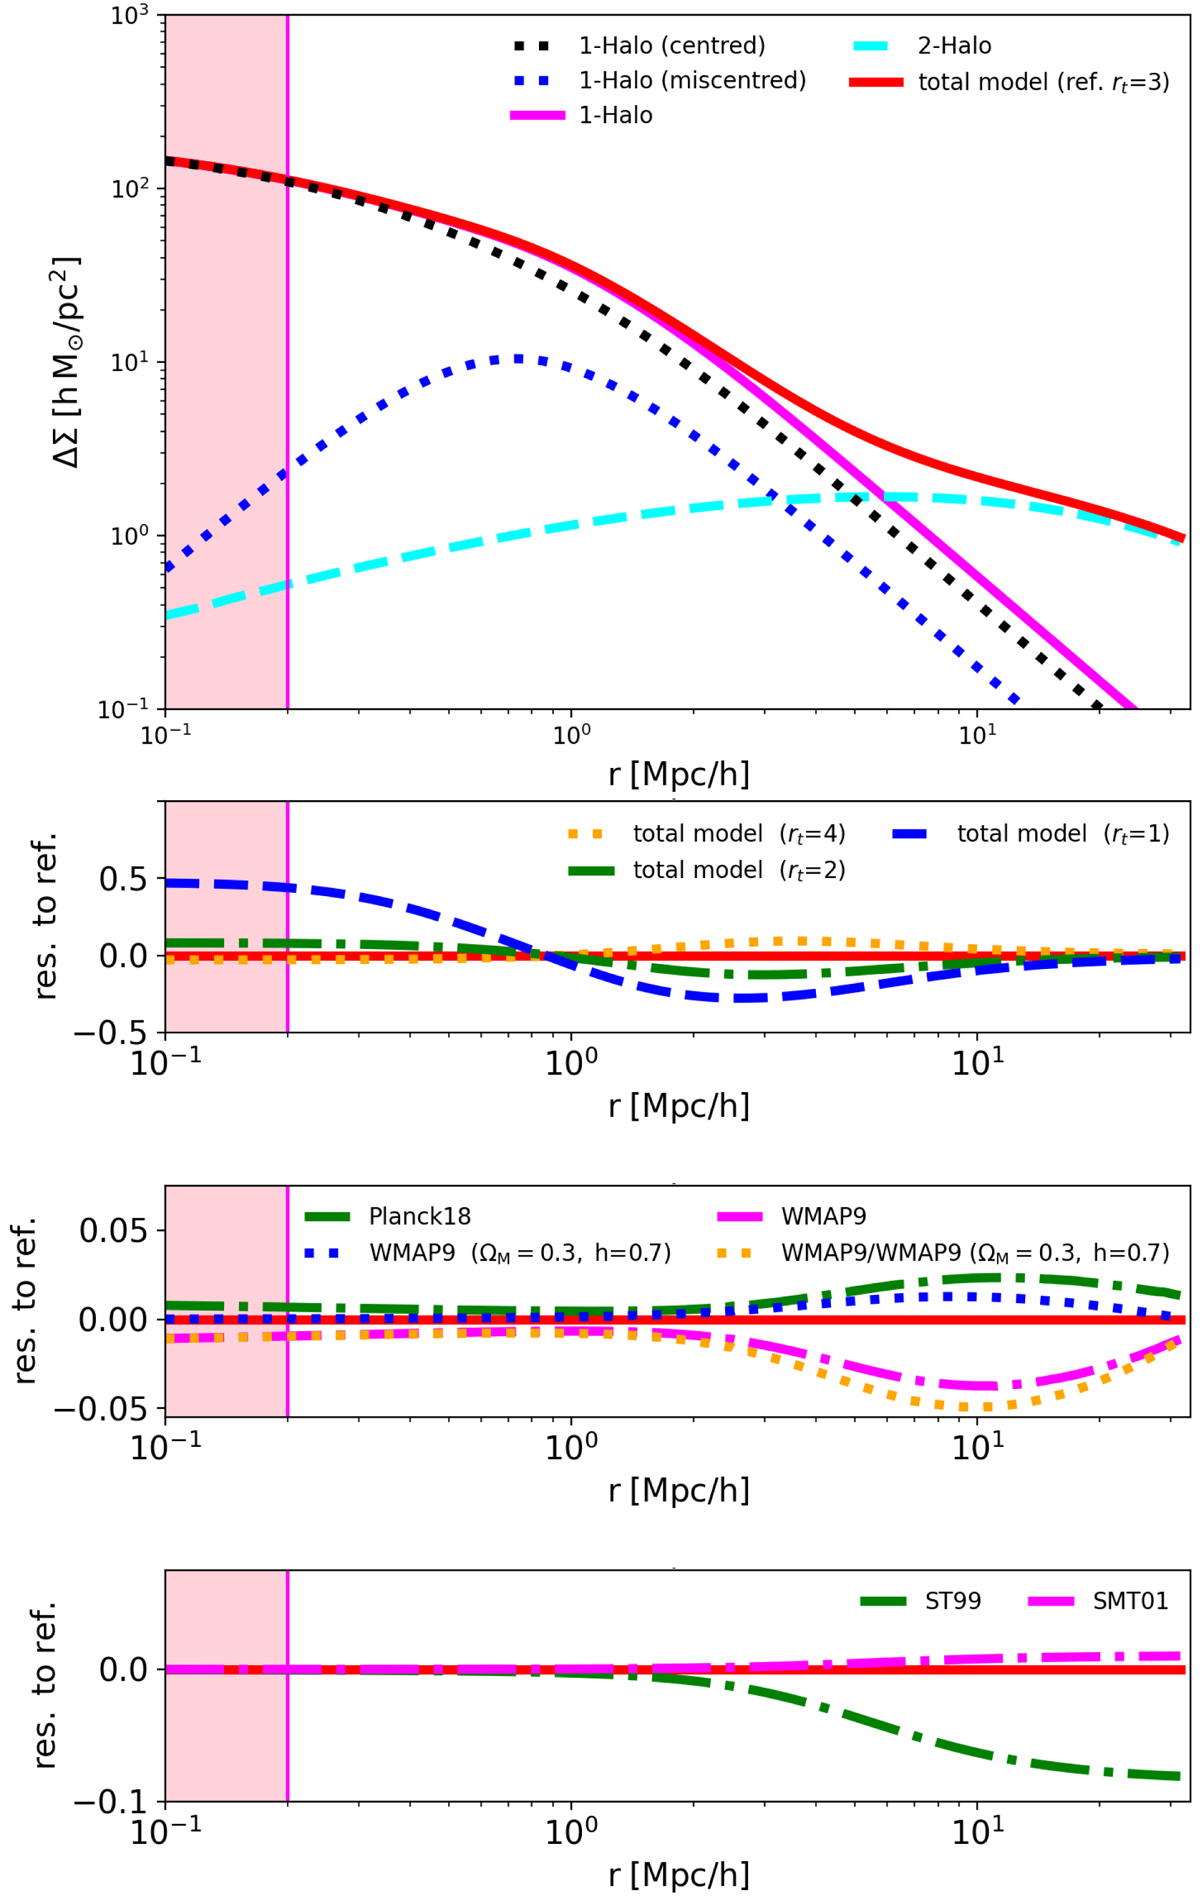
Download original image
Differencial surface density profile model as a function of radius. Upper panel: model of the projected excess of surface mass density as a function of the comoving radial distance from the centre for a cluster with M200 = 1014 M⊙ h−1, c200 = 3 at redshift z = 0.3, with σoff = 0.3 and foff = 0.3. The radius enclosing 200 times the critical density corresponds to R200 = 1.47 Mpc h−1. The four one-halo and two-halo terms are shown with different colours and styles, as labelled. Second panel: relative differences, with respect to the reference, of the models with rt = 1, 2, and 4. Third panel: relative differences, with respect to the reference, of the models with the linear power spectrum estimated assuming different cosmological model parameters, as labelled. Shown for comparison (yellow dotted curve) is the relative difference between the prediction adopting WMAP9 cosmology and WMAP9, but fixing ΩM = 0.3 and h = 0.7. Bottom panel: relative differences, with respect to the reference, of two models constructed with either the Sheth & Tormen (1999) or the Sheth et al. (2001) biasing model.
Current usage metrics show cumulative count of Article Views (full-text article views including HTML views, PDF and ePub downloads, according to the available data) and Abstracts Views on Vision4Press platform.
Data correspond to usage on the plateform after 2015. The current usage metrics is available 48-96 hours after online publication and is updated daily on week days.
Initial download of the metrics may take a while.