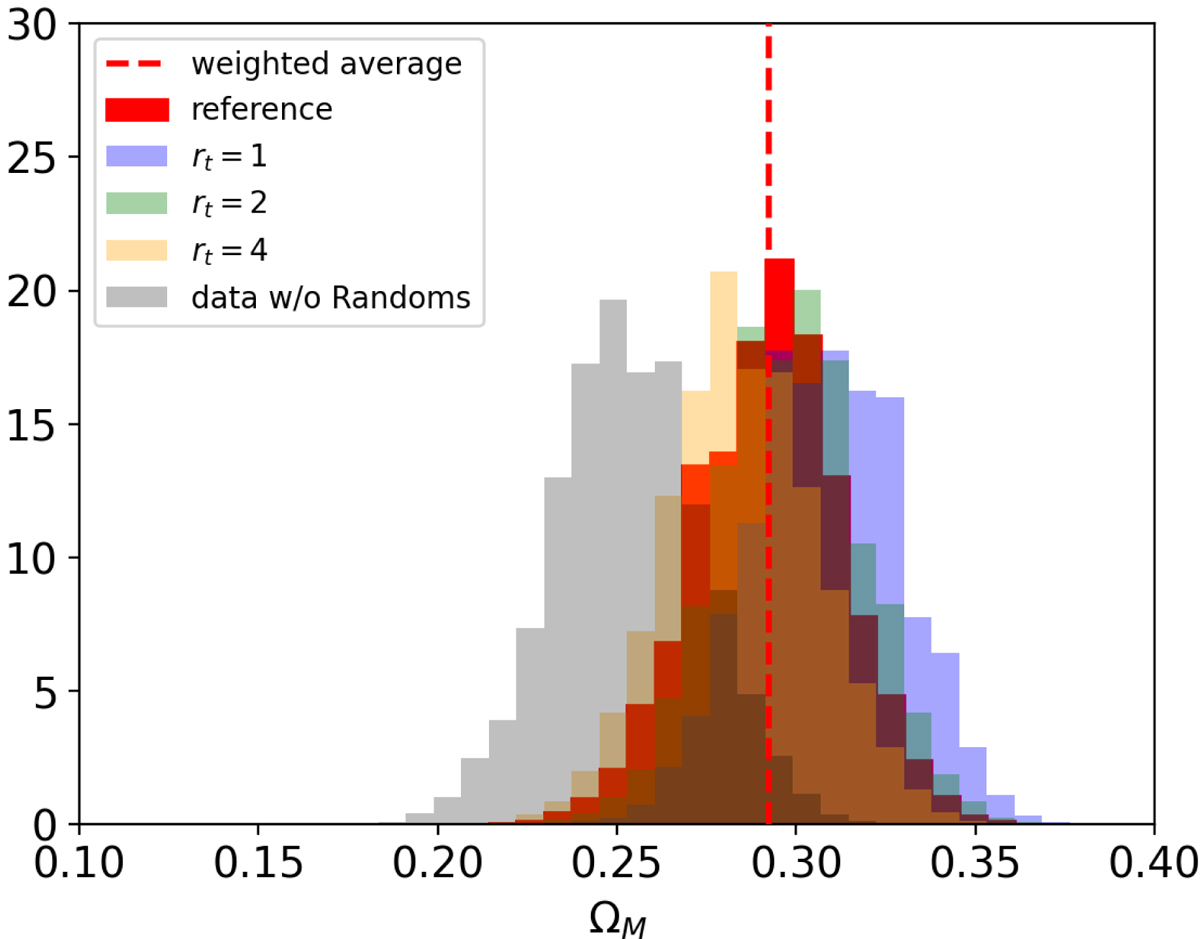
Fig. B.1.
Download original image
Combined posteriors, in redshift, for the recovered total matter density parameter assuming different values of the truncation radius. The red-filled histogram shows the posterior of our reference model with rt = 3. The gold, green, and blue histograms show the distributions of ΩM assuming rt = 4, 2, and 1, respectively. The grey histogram shows the result obtained from the stacked profiles estimated without accounting for the signal around random centres. The vertical red dashed line indicates the weighted average of the reference posterior distribution.
Current usage metrics show cumulative count of Article Views (full-text article views including HTML views, PDF and ePub downloads, according to the available data) and Abstracts Views on Vision4Press platform.
Data correspond to usage on the plateform after 2015. The current usage metrics is available 48-96 hours after online publication and is updated daily on week days.
Initial download of the metrics may take a while.