Fig. 10.
Download original image
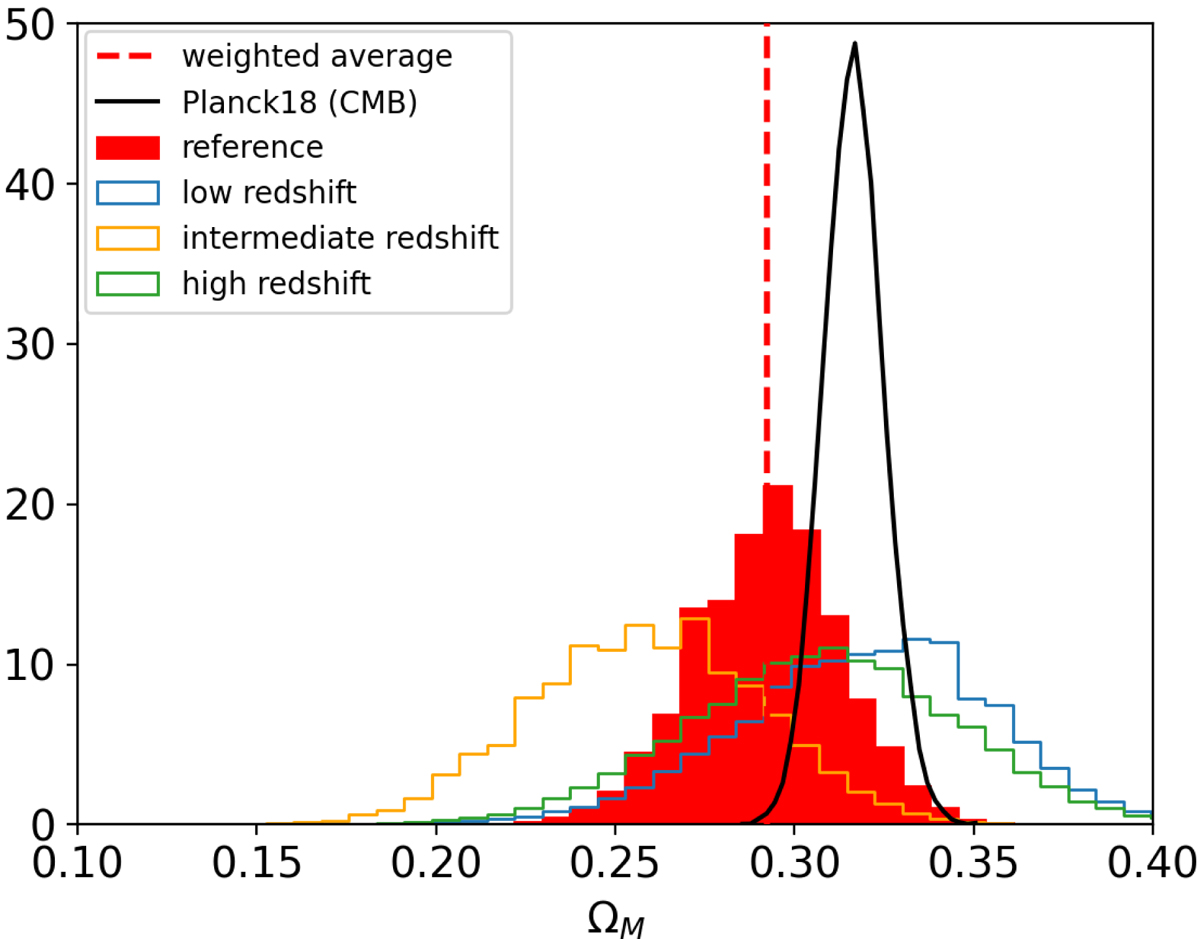
Posterior distributions of the total matter density parameter ΩM. The blue, orange, and green histograms show the results for the low, intermediate, and high redshift cluster samples, respectively. The red-filled histogram exhibits the posterior distribution combining all redshifts together; the dashed red line indicates the median of the distribution. The black curve displays the posterior distribution obtained from the analysis of the CMB data by Planck Collaboration VI (2020).
Current usage metrics show cumulative count of Article Views (full-text article views including HTML views, PDF and ePub downloads, according to the available data) and Abstracts Views on Vision4Press platform.
Data correspond to usage on the plateform after 2015. The current usage metrics is available 48-96 hours after online publication and is updated daily on week days.
Initial download of the metrics may take a while.