Fig. A.1
Download original image
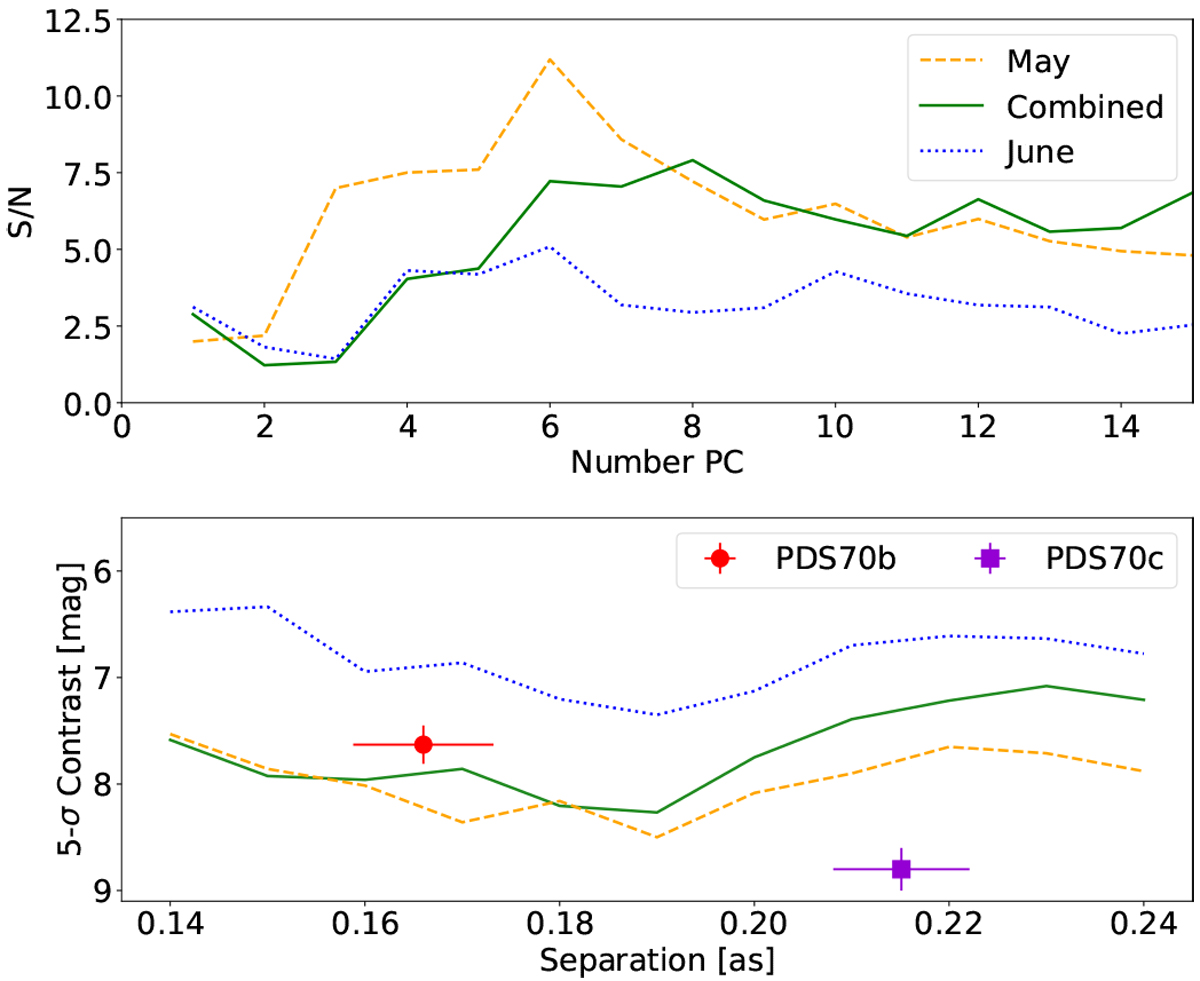
Evaluation of the two VLT/SINFONI datasets. Top: S/N of PDS70 b for the first dataset (orange dashed line), the second dataset (blue dotted line), and the combination of the two (green solid line) as a function of the number of removed principal components. Bottom: contrast curves obtained for the three considered datasets. The colors and linestyles are the same as in the top panel. PDS70 b separation and contrast estimates (see Appendix B) is shown as a red square. PDS70 c position and contrast are from Haffert et al. (2019).
Current usage metrics show cumulative count of Article Views (full-text article views including HTML views, PDF and ePub downloads, according to the available data) and Abstracts Views on Vision4Press platform.
Data correspond to usage on the plateform after 2015. The current usage metrics is available 48-96 hours after online publication and is updated daily on week days.
Initial download of the metrics may take a while.