Fig. 6
Download original image
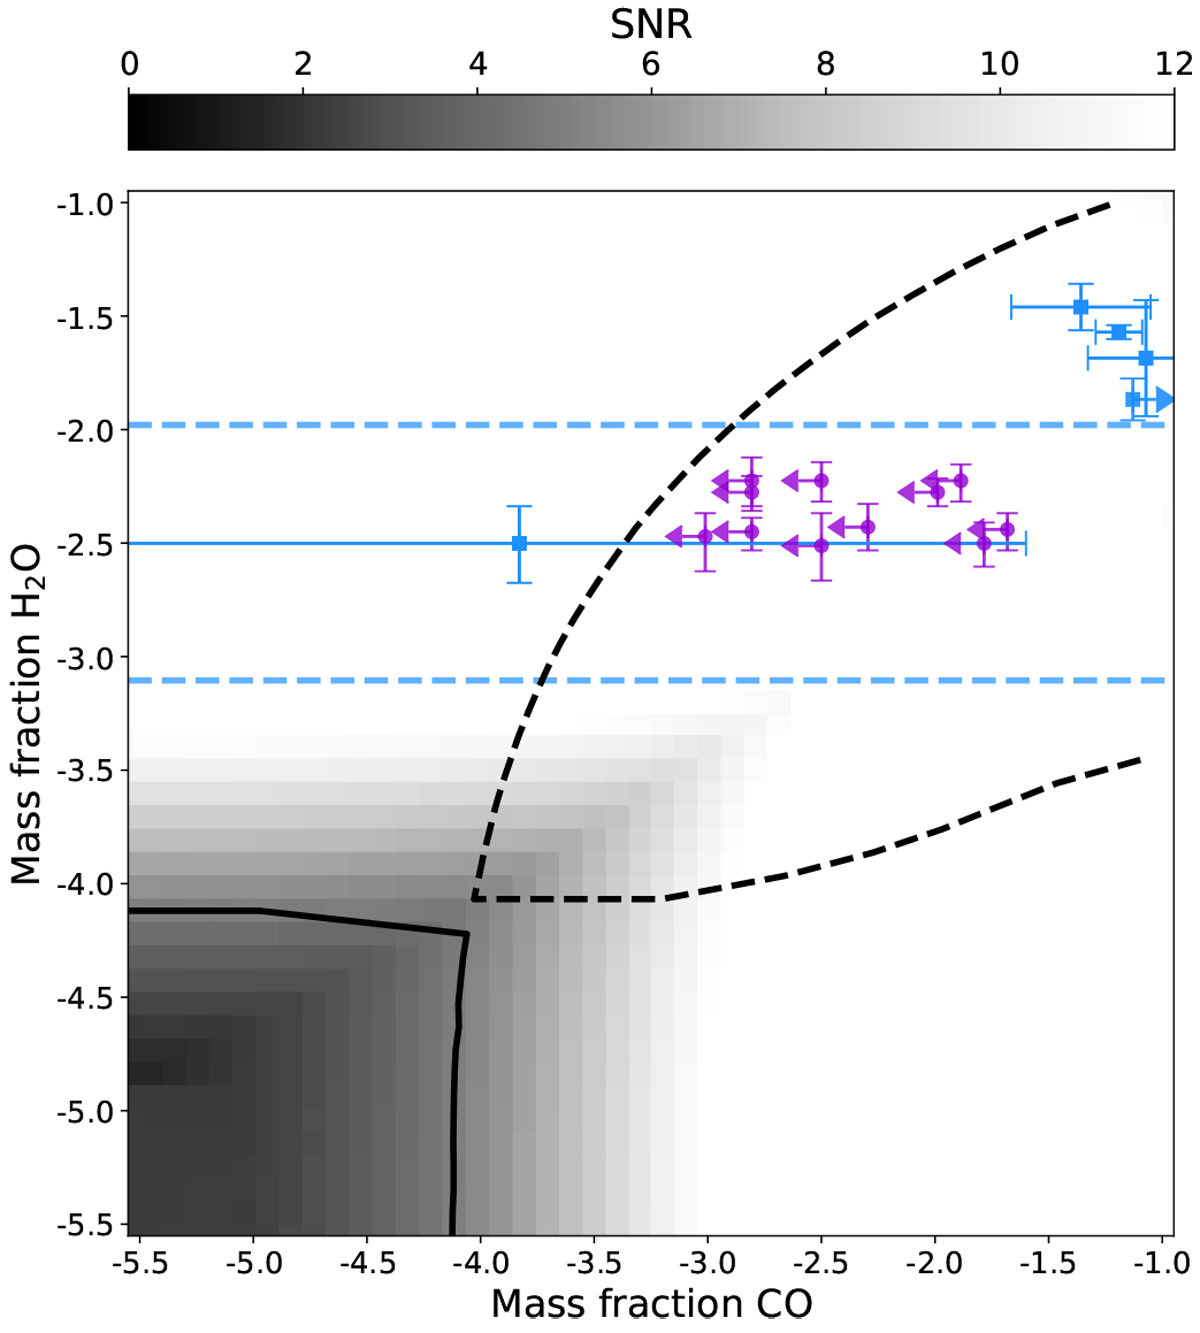
Comparison of the detectability of molecules in the SINFONI data with measured abundances from substellar objects. The blue squares represent directly imaged companions HR 8799 bce, β Pic b, and 51 Eri b (Lavie et al. 2017; Wang et al. 2020a; Mollière et al. 2020; Gravity Collaboration 2020; Whiteford et al. 2020); the blue lines show the measured range for H2O in κ And b (Todorov et al. 2016). The blue arrow indicates that the measured value is higher than the range of abundances shown in the plot. The violet circles represent a sample of T dwarfs analyzed in Line et al. (2017), and here the arrows refer to upper limits. The solid black line represents the region where no molecule would have been detected in our SINFONI data because the mass fractions were too low. The dashed black line encloses the region where, conversely, both molecules would have been detected.
Current usage metrics show cumulative count of Article Views (full-text article views including HTML views, PDF and ePub downloads, according to the available data) and Abstracts Views on Vision4Press platform.
Data correspond to usage on the plateform after 2015. The current usage metrics is available 48-96 hours after online publication and is updated daily on week days.
Initial download of the metrics may take a while.