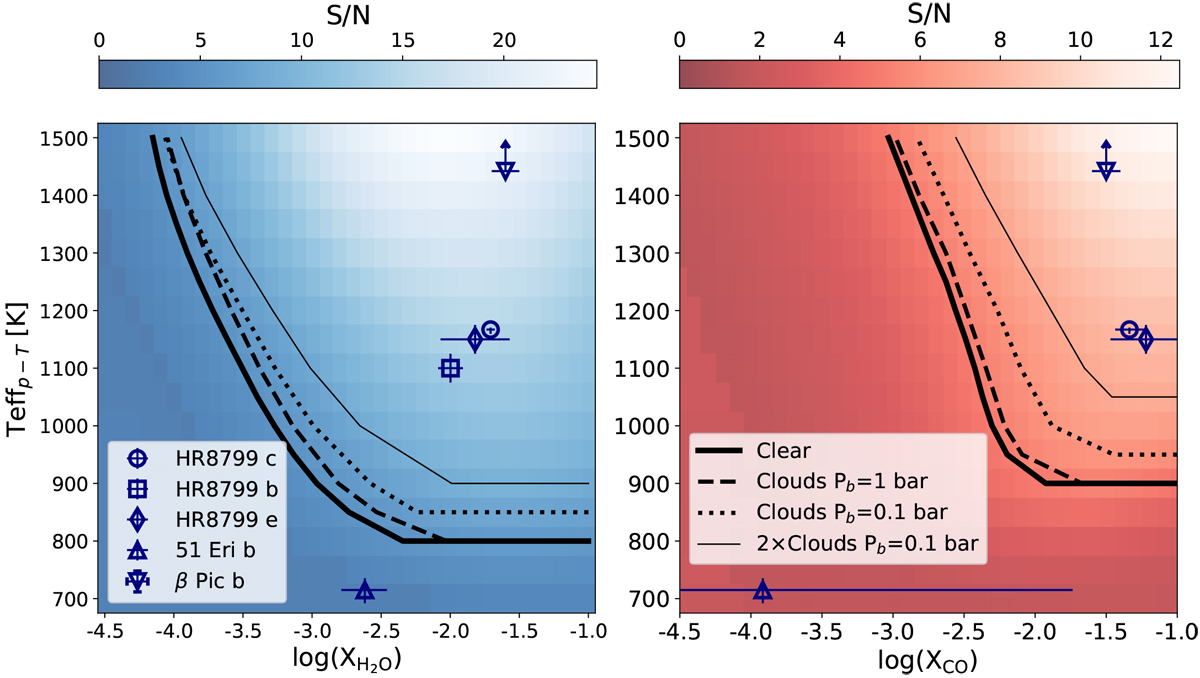
Fig. 4
Download original image
Detection maps of H2O (left) and CO (right) for clear atmospheres as a function of mass fraction Xmol and effective temperature Teff, pT of the planet. The symbols represent measurements for other directly imaged companions (see left panel inset). The thick solid lines separate the region with S∕N > 5 from regions with S∕N < 5, i.e., they represent the molecular detection limit as a function of planet temperature. The dashed, dotted, and thin solid lines represent the molecular detection limits for different cloud configurations based on Mollière et al. (2020), as described in the main text (Pb = 10−3 bar is not shown). The temperature of PDS70 b ranges between 1200 and 1400 K (Stolker et al. 2020a; Wang et al. 2021). The effectivetemperature of β Pic b is well constrained as Teff = 1742 ± 16 K (Gravity Collaboration 2020) and the arrow in its symbol indicates that it is higher than the maximum Teff, pT considered here and should not be interpreted as a lower limit.
Current usage metrics show cumulative count of Article Views (full-text article views including HTML views, PDF and ePub downloads, according to the available data) and Abstracts Views on Vision4Press platform.
Data correspond to usage on the plateform after 2015. The current usage metrics is available 48-96 hours after online publication and is updated daily on week days.
Initial download of the metrics may take a while.