Fig. 3
Download original image
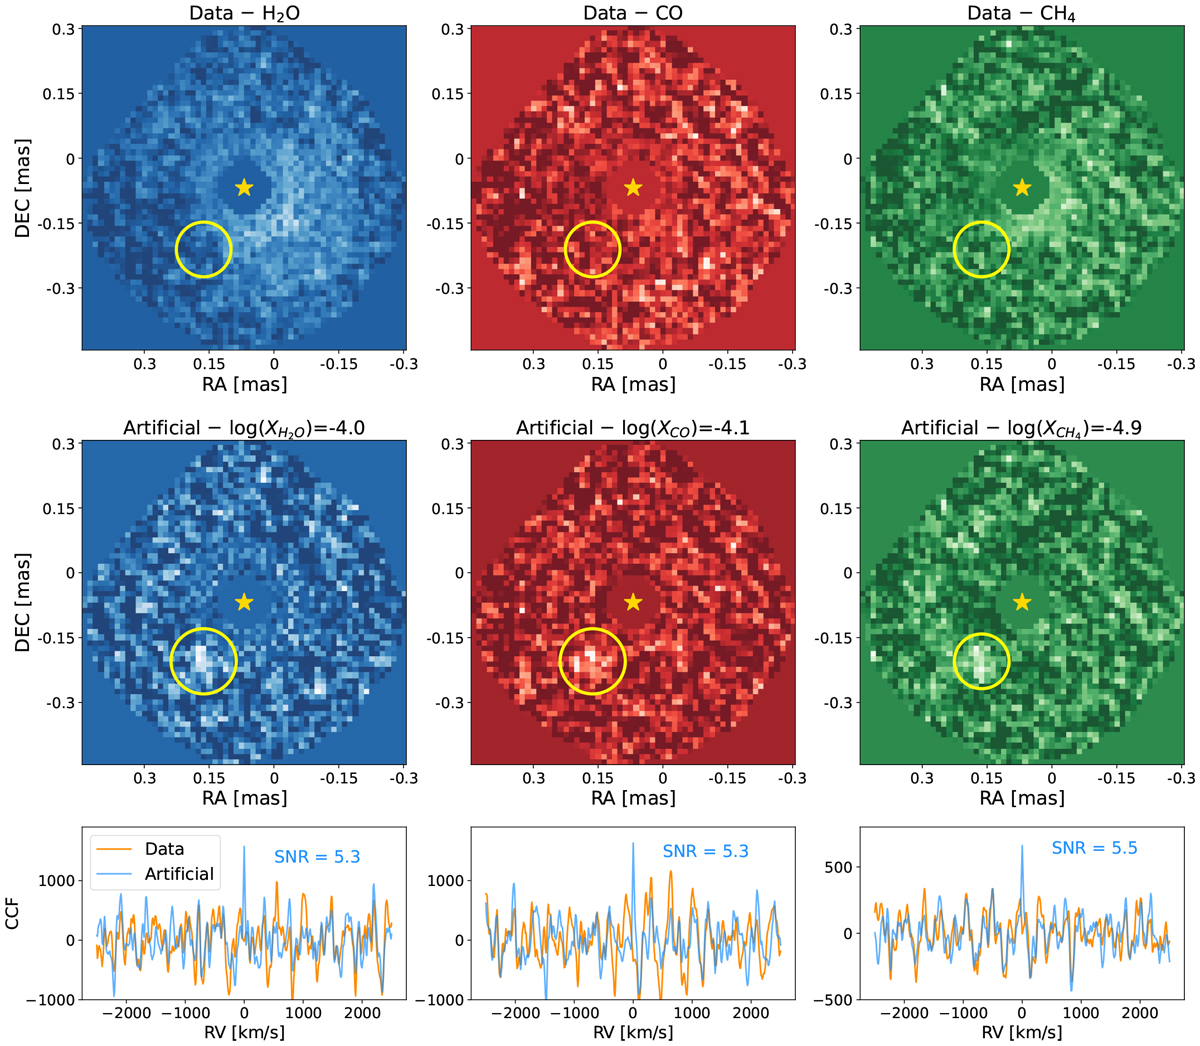
Molecular maps of the PDS70 system and CCFs at the position of the b planet. Top row: H2O, CO, and CH4 molecular maps at RV ~ − 5 km s−1. The central star represents the position of PDS70 A, while the yellow circle indicates where a signal from PDS70 b should be found. Middle row: same as in the top row, but a planet with the molecular abundances indicated at the top of each panel has been inserted in the data and detected with S∕N ~ 5. Bottom row: CCF as a function of the radial velocity at the location of the planet. The orange lines represent for each molecule the CCF of the data, while the blue lines are the CCFs of the inserted artificial planets.
Current usage metrics show cumulative count of Article Views (full-text article views including HTML views, PDF and ePub downloads, according to the available data) and Abstracts Views on Vision4Press platform.
Data correspond to usage on the plateform after 2015. The current usage metrics is available 48-96 hours after online publication and is updated daily on week days.
Initial download of the metrics may take a while.