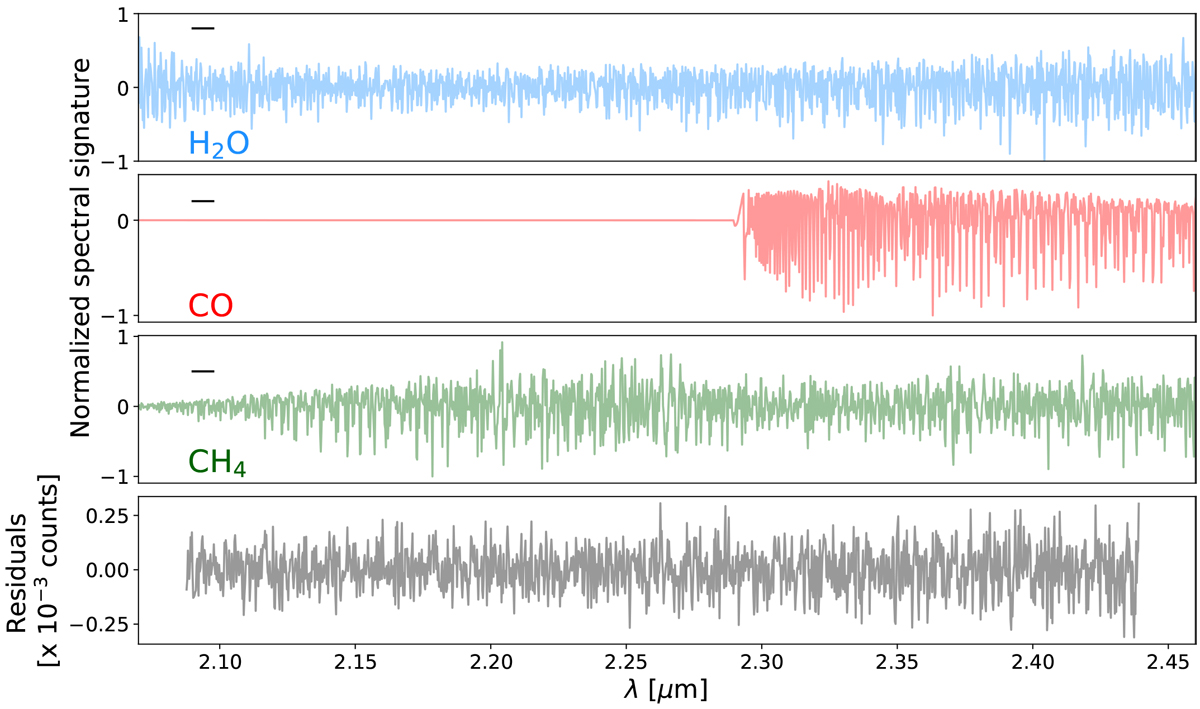
Fig. 2
Download original image
Molecular templates after removal of the continua (H2O in blue, CO in red, and CH4 in green) and residuals of the data at the position of the planet (gray). No broad feature is visible and only individual absorption lines at the instrument resolution are cross-correlated. The small black dash in the top left corner of the first three panelsrepresents the filter size for continuum removal. Features smaller than this are kept in the residuals, while larger structures are removed as part of the continuum.
Current usage metrics show cumulative count of Article Views (full-text article views including HTML views, PDF and ePub downloads, according to the available data) and Abstracts Views on Vision4Press platform.
Data correspond to usage on the plateform after 2015. The current usage metrics is available 48-96 hours after online publication and is updated daily on week days.
Initial download of the metrics may take a while.