Fig. A.2
Download original image
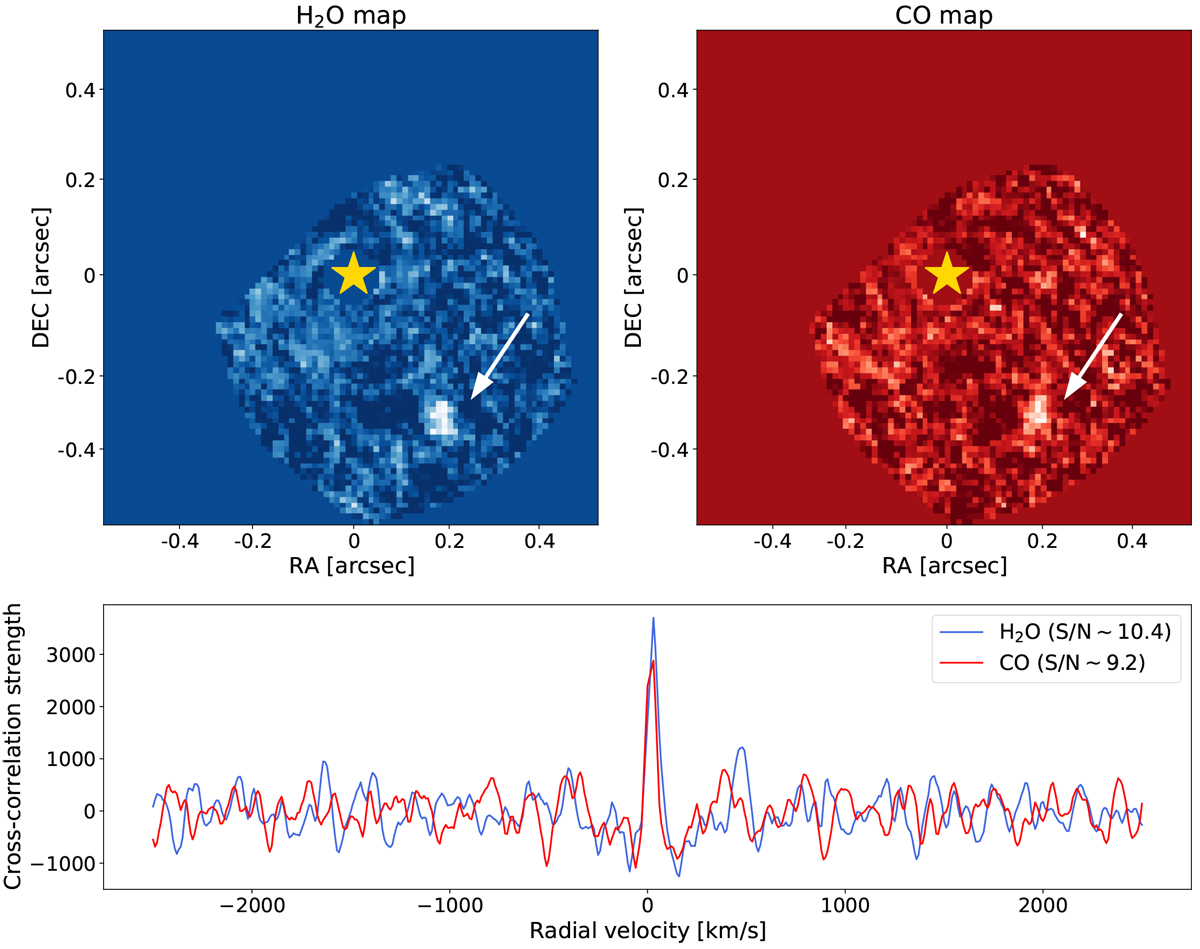
Results after using our pipeline on an archival β Pic b dataset. Top: molecular maps for H2O and CO obtained from a dataset of β Pic published inHoeijmakers et al. (2018). North is pointing to the top, east to the left. Bottom: cross-correlation function extracted atthe planet position. The peaks representing the detection of water and carbon monoxide are clearly visible.
Current usage metrics show cumulative count of Article Views (full-text article views including HTML views, PDF and ePub downloads, according to the available data) and Abstracts Views on Vision4Press platform.
Data correspond to usage on the plateform after 2015. The current usage metrics is available 48-96 hours after online publication and is updated daily on week days.
Initial download of the metrics may take a while.