Fig. 4.
Download original image
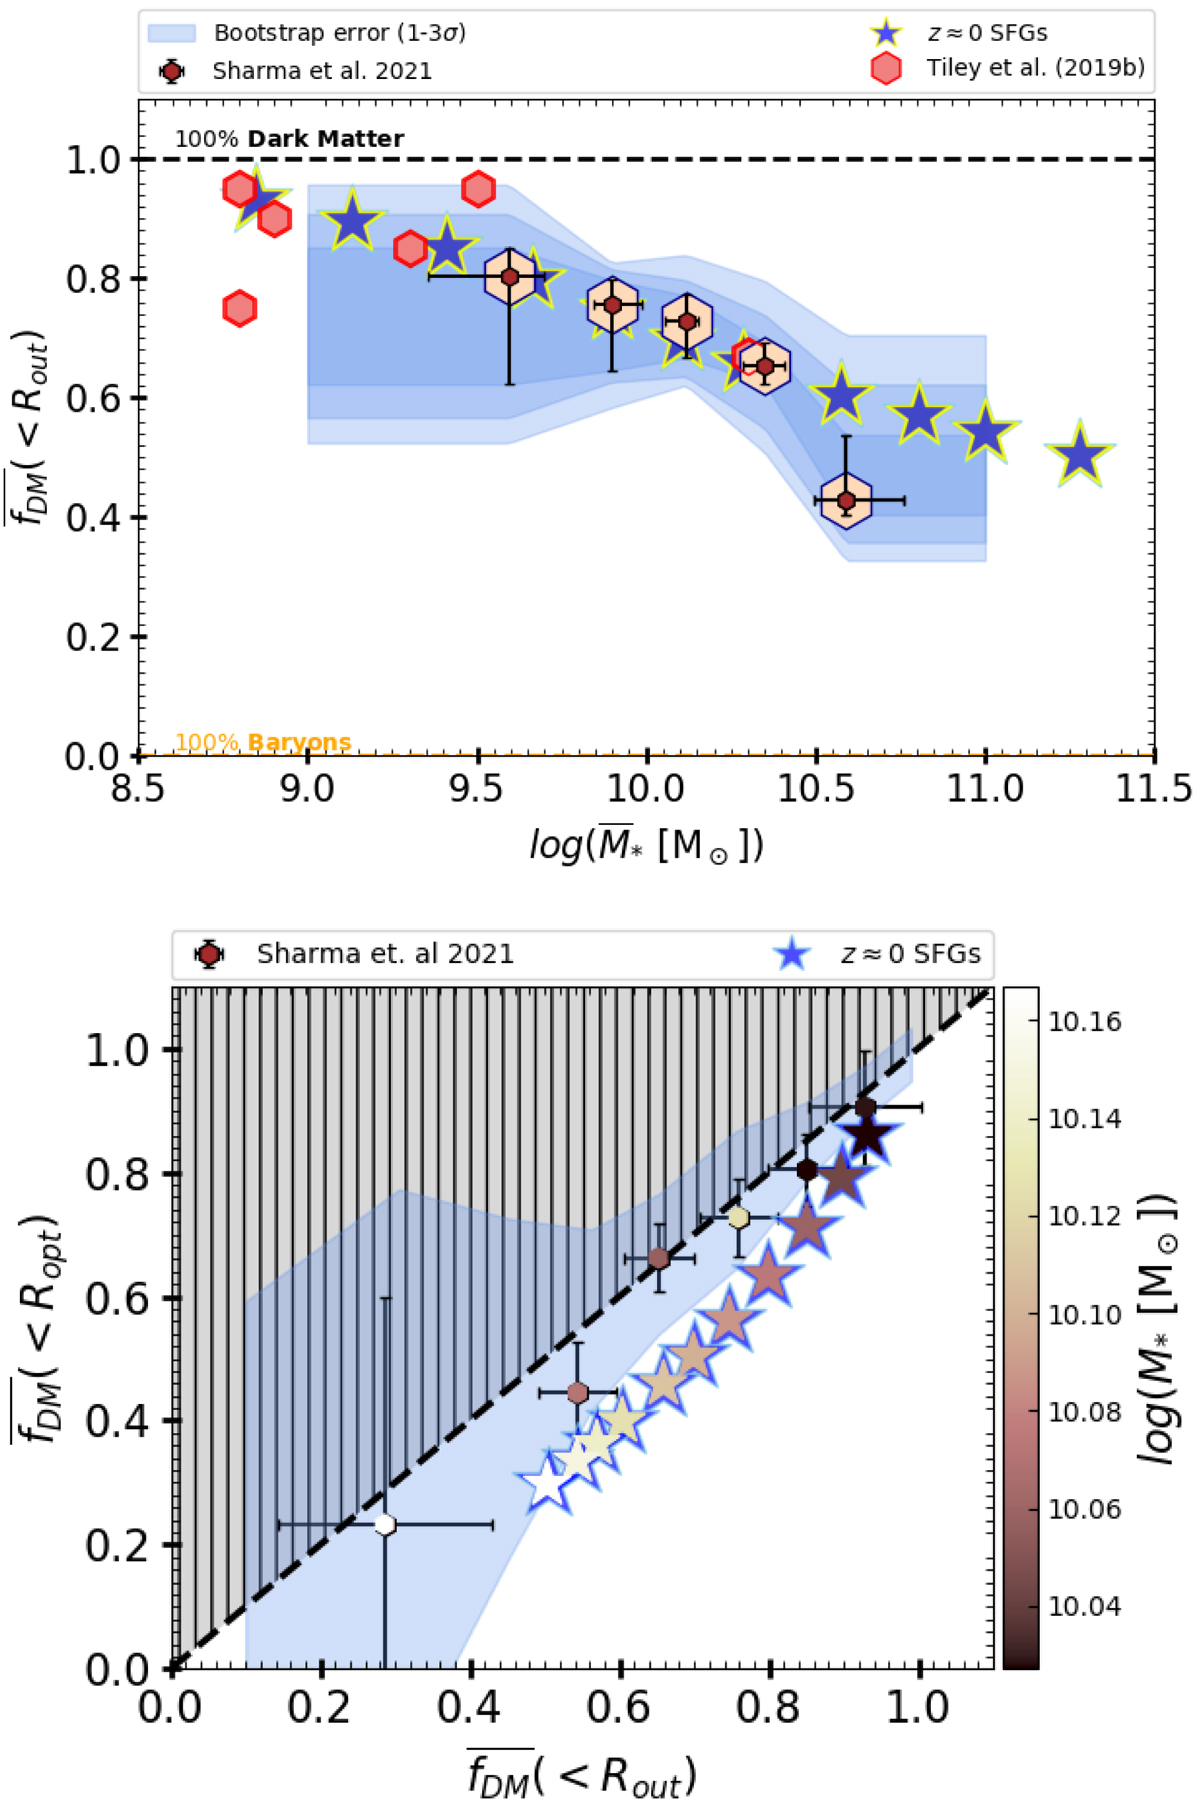
DM fraction of ensemble averages. Upper panel: dark matter fraction within Rout as a function of stellar mass (![]() ). The brown hexagons with error bars shielded by big light-peach hexagons represent our averaged data, and the blue shaded area shows the 1, 2, and 3σ error at DM fraction. For comparison, we show the local star-forming disk galaxies (Persic et al. 1996) represented by the blue stars (in both panels), where the size of the marker represents the uncertainty in the values. The red hexagon represents the z ∼ 1 SFGs (Tiley et al. 2019b). Lower panel:
). The brown hexagons with error bars shielded by big light-peach hexagons represent our averaged data, and the blue shaded area shows the 1, 2, and 3σ error at DM fraction. For comparison, we show the local star-forming disk galaxies (Persic et al. 1996) represented by the blue stars (in both panels), where the size of the marker represents the uncertainty in the values. The red hexagon represents the z ∼ 1 SFGs (Tiley et al. 2019b). Lower panel: ![]() vs.
vs. ![]() , color coded by stellar mass. The gray shaded area represents the theoretically not allowed region (i.e.,
, color coded by stellar mass. The gray shaded area represents the theoretically not allowed region (i.e., ![]() . The blue shaded area shows the maximum scatter in the relation. The lower panel interior of blue stars are color coded by stellar mass.
. The blue shaded area shows the maximum scatter in the relation. The lower panel interior of blue stars are color coded by stellar mass.
Current usage metrics show cumulative count of Article Views (full-text article views including HTML views, PDF and ePub downloads, according to the available data) and Abstracts Views on Vision4Press platform.
Data correspond to usage on the plateform after 2015. The current usage metrics is available 48-96 hours after online publication and is updated daily on week days.
Initial download of the metrics may take a while.