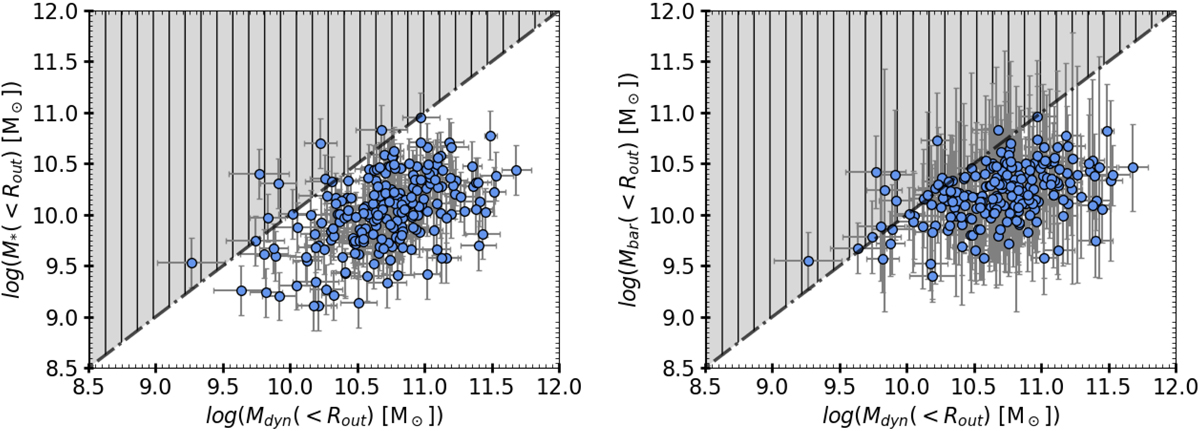
Fig. 2.
Download original image
Stellar and baryonic masses as a function of dynamical mass (left and right panels, respectively), computed within Rout. The notations and color codes are the same in both panels and are given as follows: the blue filled circles represent the data, the dot-dashed black line shows the one-to-one plane, and the hatched-shaded gray area represents the forbidden region.
Current usage metrics show cumulative count of Article Views (full-text article views including HTML views, PDF and ePub downloads, according to the available data) and Abstracts Views on Vision4Press platform.
Data correspond to usage on the plateform after 2015. The current usage metrics is available 48-96 hours after online publication and is updated daily on week days.
Initial download of the metrics may take a while.