Fig. 9.
Download original image
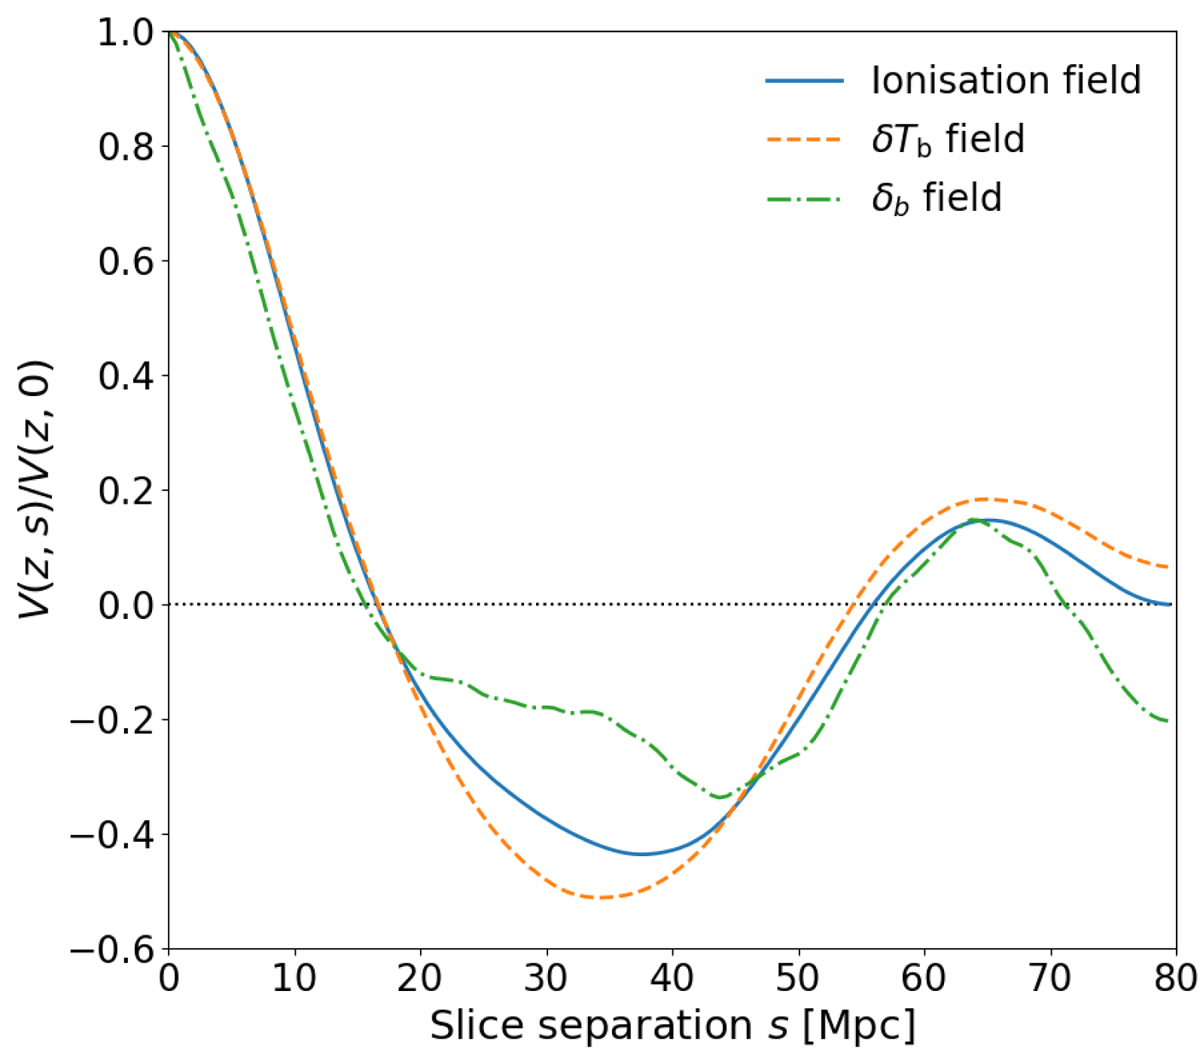
Cross-correlations between the average values of two slices cut through the M9 simulation and separated by a distance s, for the snapshot corresponding to z = 7.2, normalised by the value at s = 0. Results are presented for the ionisation field (solid blue line) and the 21 cm brightness temperature field (dashed orange line).
Current usage metrics show cumulative count of Article Views (full-text article views including HTML views, PDF and ePub downloads, according to the available data) and Abstracts Views on Vision4Press platform.
Data correspond to usage on the plateform after 2015. The current usage metrics is available 48-96 hours after online publication and is updated daily on week days.
Initial download of the metrics may take a while.