Fig. 8.
Download original image
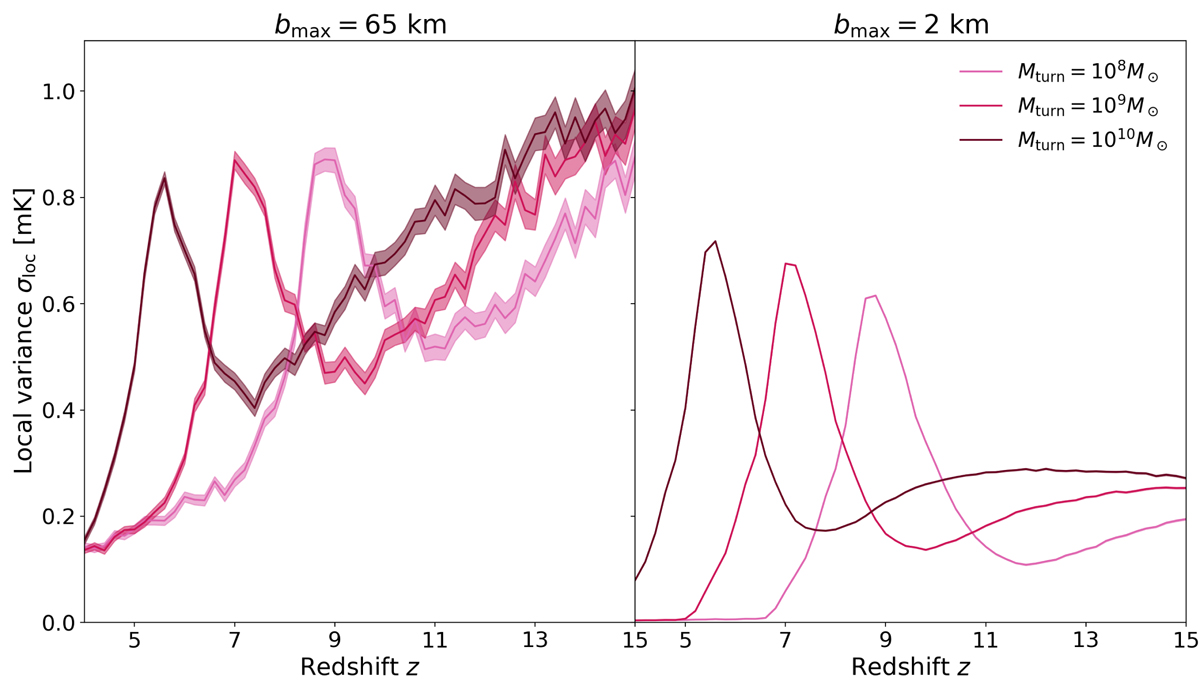
Local variance of the 21 cm brightness temperature maps of the 21cmFAST simulations, after applying telescope resolution smoothing and adding telescope noise, for an optimistic case (bmax = 65 km, left), and a pessimistic case (bmax = 2 km, right). The shaded regions correspond to the standard deviation of the σloc values obtained from 100 different realisations of the thermal noise.
Current usage metrics show cumulative count of Article Views (full-text article views including HTML views, PDF and ePub downloads, according to the available data) and Abstracts Views on Vision4Press platform.
Data correspond to usage on the plateform after 2015. The current usage metrics is available 48-96 hours after online publication and is updated daily on week days.
Initial download of the metrics may take a while.