Open Access
Fig. 6.
Download original image
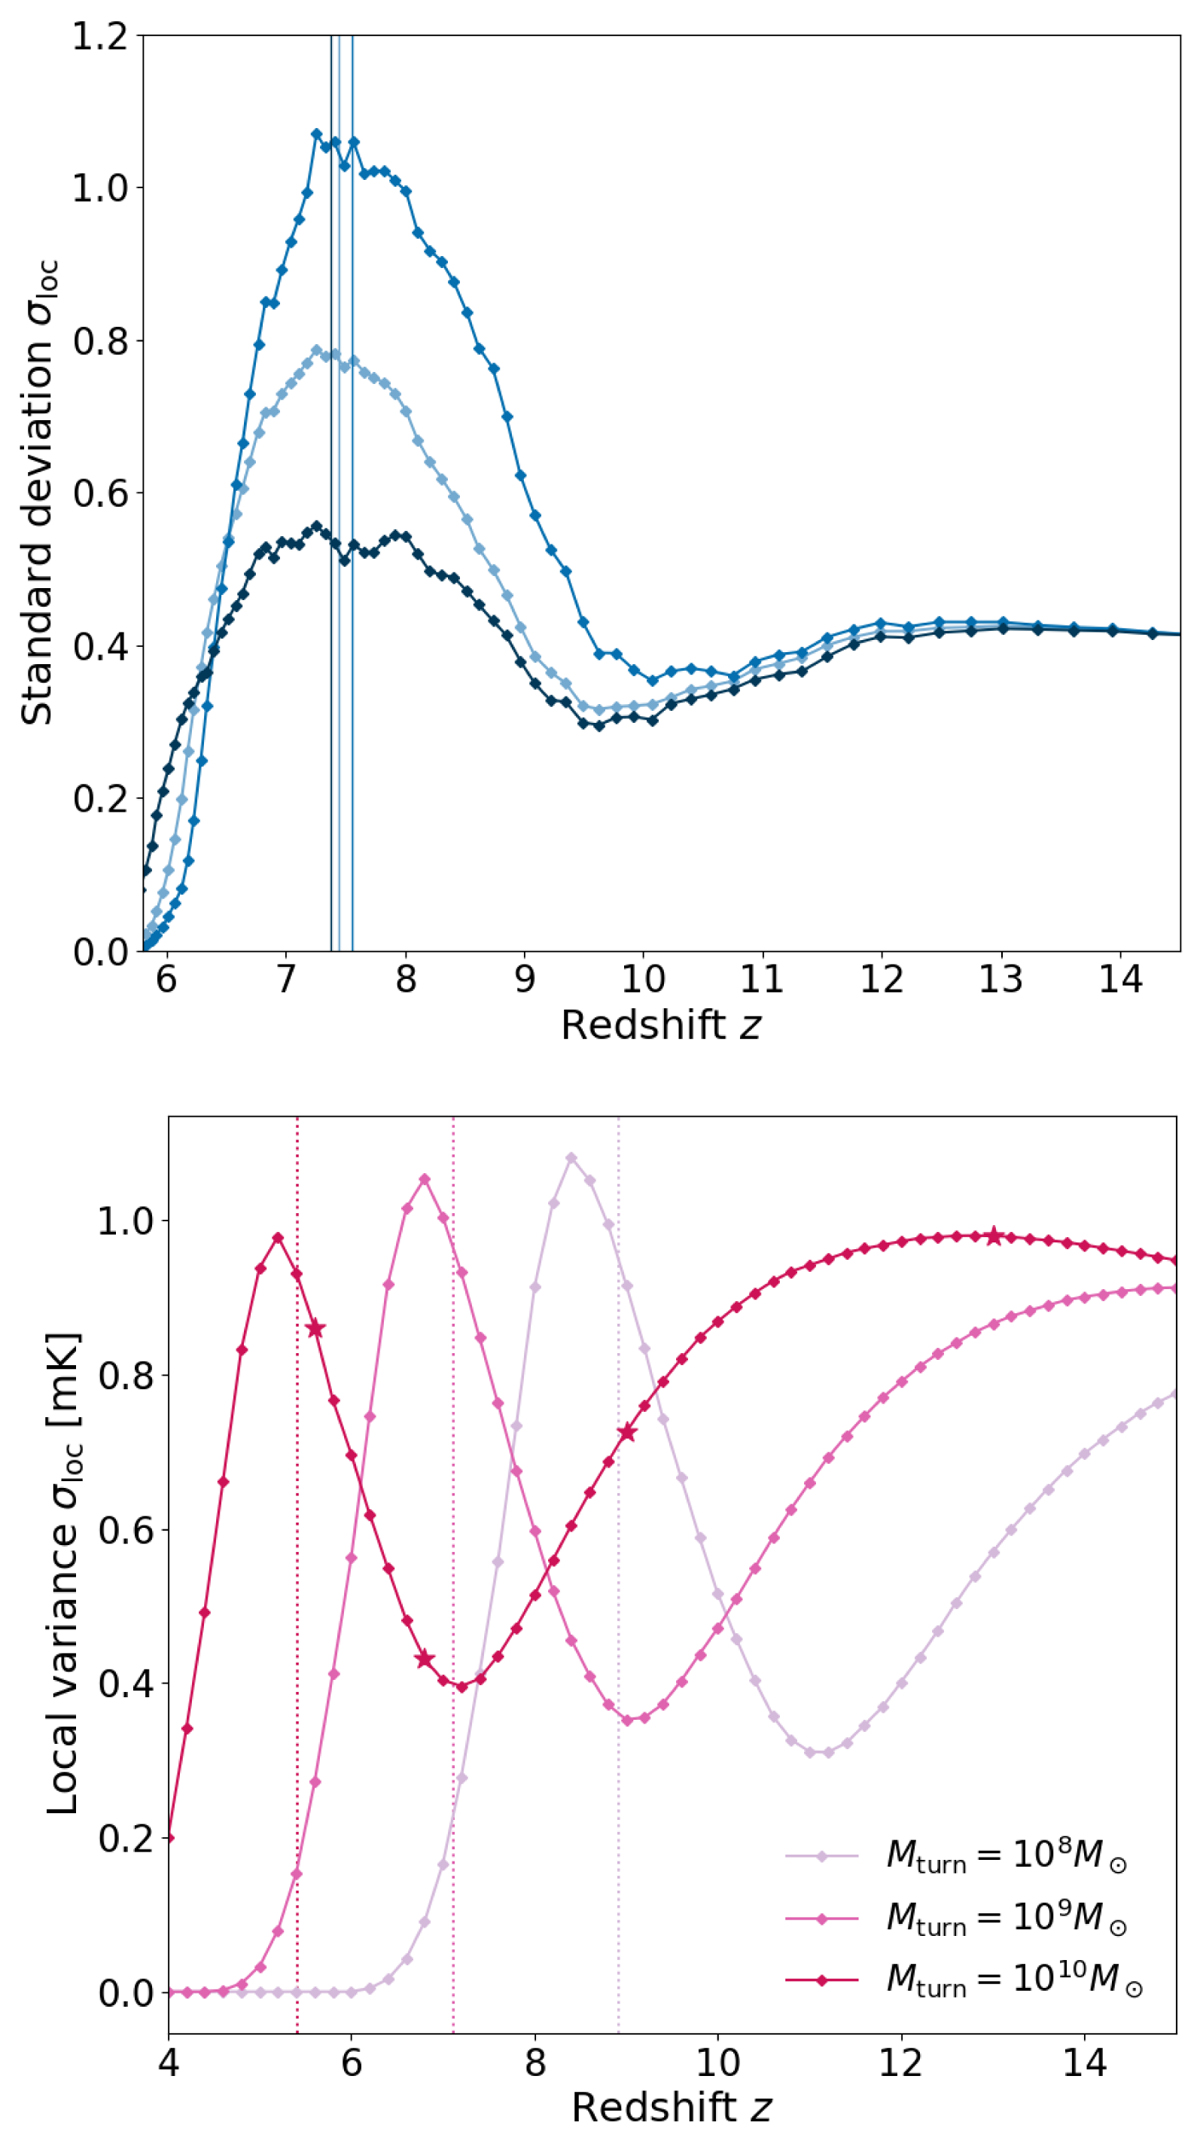
Local variance of the 21 cm brightness temperature fields from the rsage (upper panel) and 21cmFAST (lower panel) simulation, as a function of redshift. Vertical dotted lines show the ionisation midpoint of the simulation of the corresponding colour.
Current usage metrics show cumulative count of Article Views (full-text article views including HTML views, PDF and ePub downloads, according to the available data) and Abstracts Views on Vision4Press platform.
Data correspond to usage on the plateform after 2015. The current usage metrics is available 48-96 hours after online publication and is updated daily on week days.
Initial download of the metrics may take a while.