Open Access
Fig. 5.
Download original image
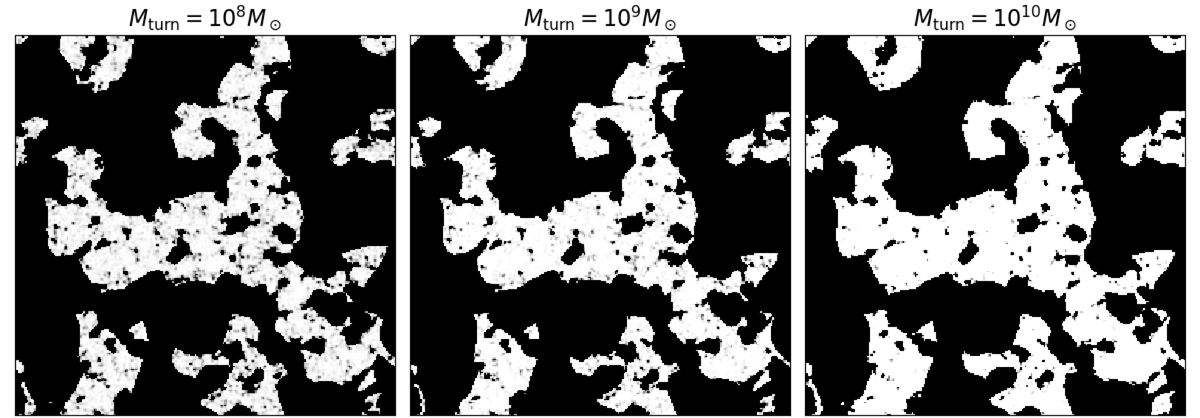
Snapshots of the ionisation field at the maximum of the local variance for the M8, M9 and M10 simulations, corresponding to different redshifts and different ionisation levels: z = 8.4 and ![]() for M8, z = 6.7 and
for M8, z = 6.7 and ![]() for M9, and z = 5.2 and
for M9, and z = 5.2 and ![]() for M10.
for M10.
Current usage metrics show cumulative count of Article Views (full-text article views including HTML views, PDF and ePub downloads, according to the available data) and Abstracts Views on Vision4Press platform.
Data correspond to usage on the plateform after 2015. The current usage metrics is available 48-96 hours after online publication and is updated daily on week days.
Initial download of the metrics may take a while.