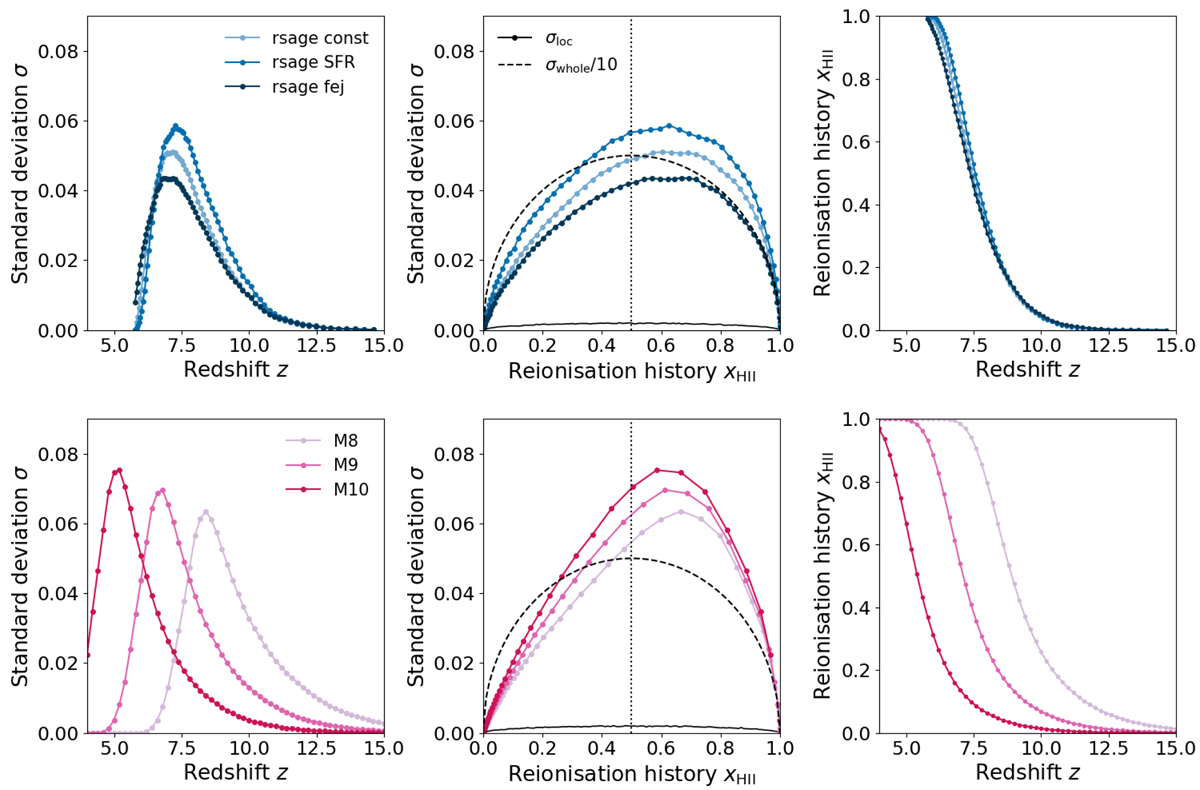
Fig. 4.
Download original image
Evolution of the standard deviation on the distribution of means measured in the set of N slices that can be carved out of the ionisation fields of simulations along one direction with redshift (left panel) and ionisation level (middle panel). Right panel: corresponding reionisation histories. Results for the three rsage simulations (upper panels) and the three 21cmFAST runs (lower panels) are compared.
Current usage metrics show cumulative count of Article Views (full-text article views including HTML views, PDF and ePub downloads, according to the available data) and Abstracts Views on Vision4Press platform.
Data correspond to usage on the plateform after 2015. The current usage metrics is available 48-96 hours after online publication and is updated daily on week days.
Initial download of the metrics may take a while.