Fig. 2.
Download original image
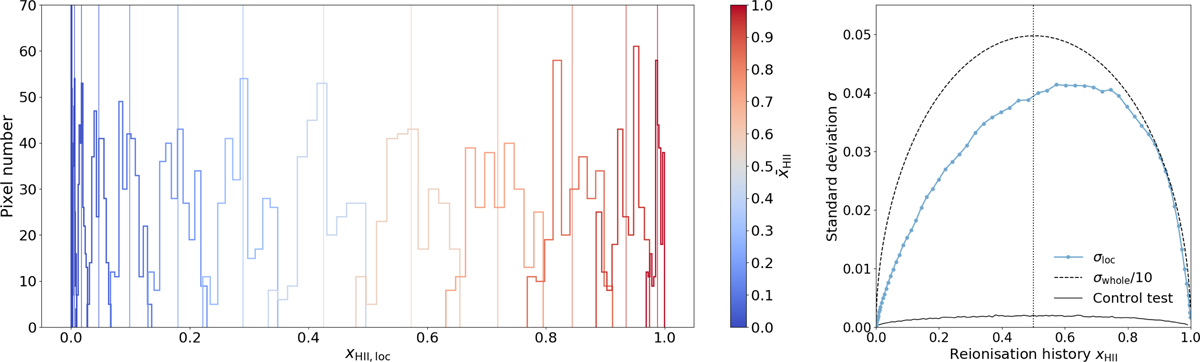
Left panel: distribution of the ionisation levels of the N slices that can be carved out of the rsage const simulation along one direction. Each colour corresponds to one of 12 snapshots taken on the range 6.02 ≤ z ≤ 14.63, corresponding to different ionisation levels, represented as the solid vertical lines. Right panel: evolution of the standard deviations of each distribution with global reionisation history (blue solid line), compared to the standard deviation of the distribution of ionised pixels throughout the whole box (dashed line, divided by 10).
Current usage metrics show cumulative count of Article Views (full-text article views including HTML views, PDF and ePub downloads, according to the available data) and Abstracts Views on Vision4Press platform.
Data correspond to usage on the plateform after 2015. The current usage metrics is available 48-96 hours after online publication and is updated daily on week days.
Initial download of the metrics may take a while.