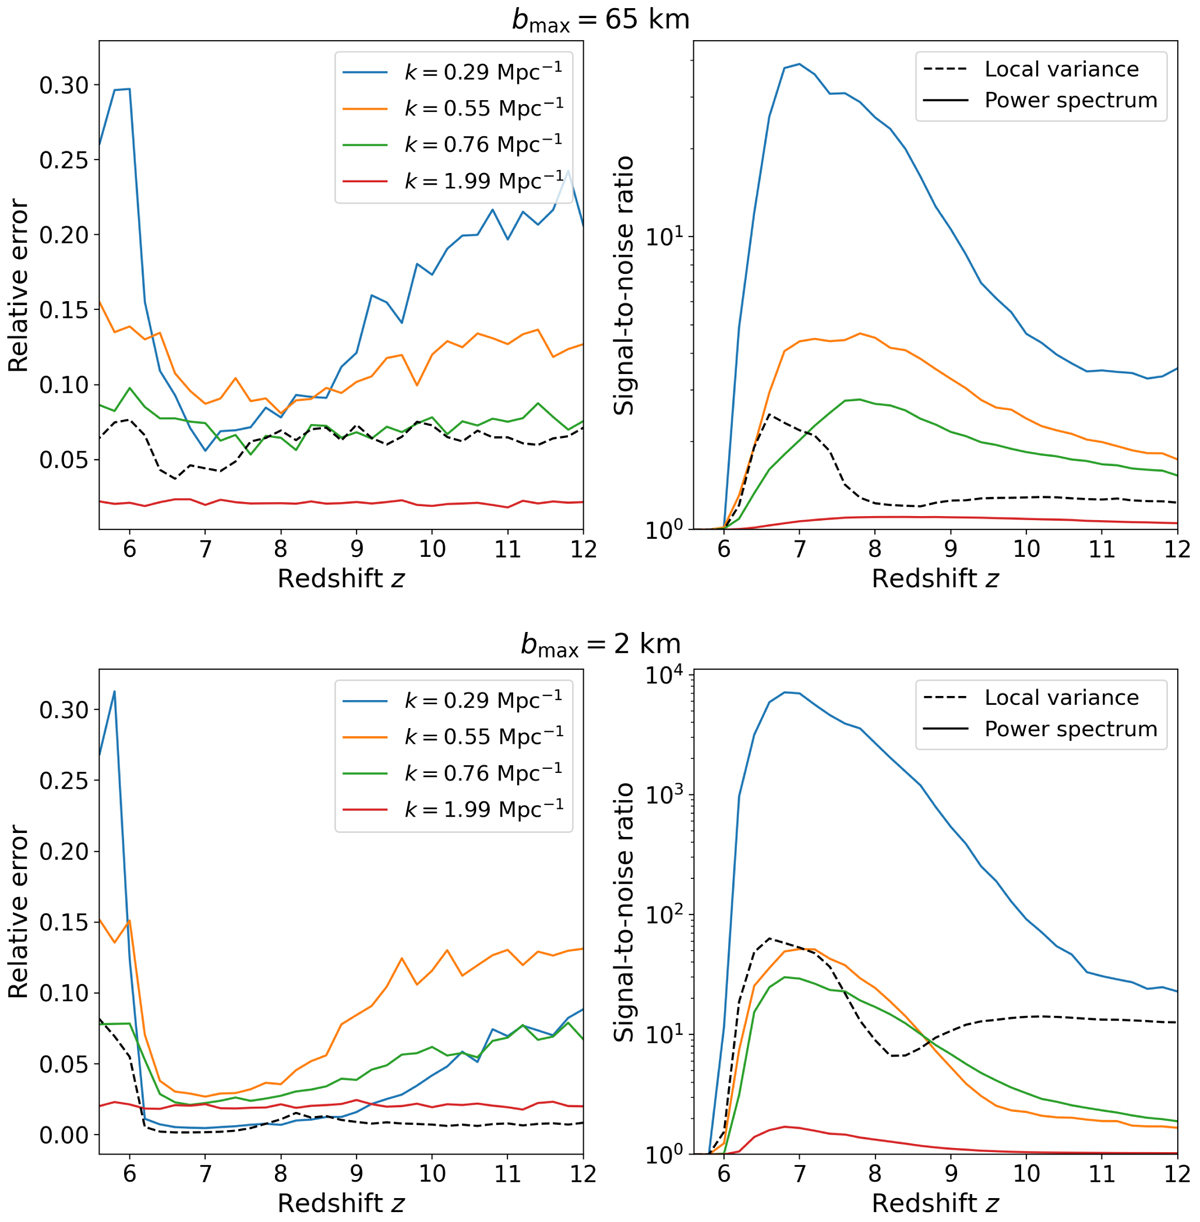
Fig. E.1.
Download original image
Relative error bars (left panel) and signal-to-noise ratio (right panel) obtained from measurements of the local variance and the 21 cm power spectrum with different realisations of the noise added to a 21cmFAST simulation. Two observational cases are considered: a maximum baseline of bmax = 65 km (upper panel), and one of bmax = 2 km (lower panel).
Current usage metrics show cumulative count of Article Views (full-text article views including HTML views, PDF and ePub downloads, according to the available data) and Abstracts Views on Vision4Press platform.
Data correspond to usage on the plateform after 2015. The current usage metrics is available 48-96 hours after online publication and is updated daily on week days.
Initial download of the metrics may take a while.