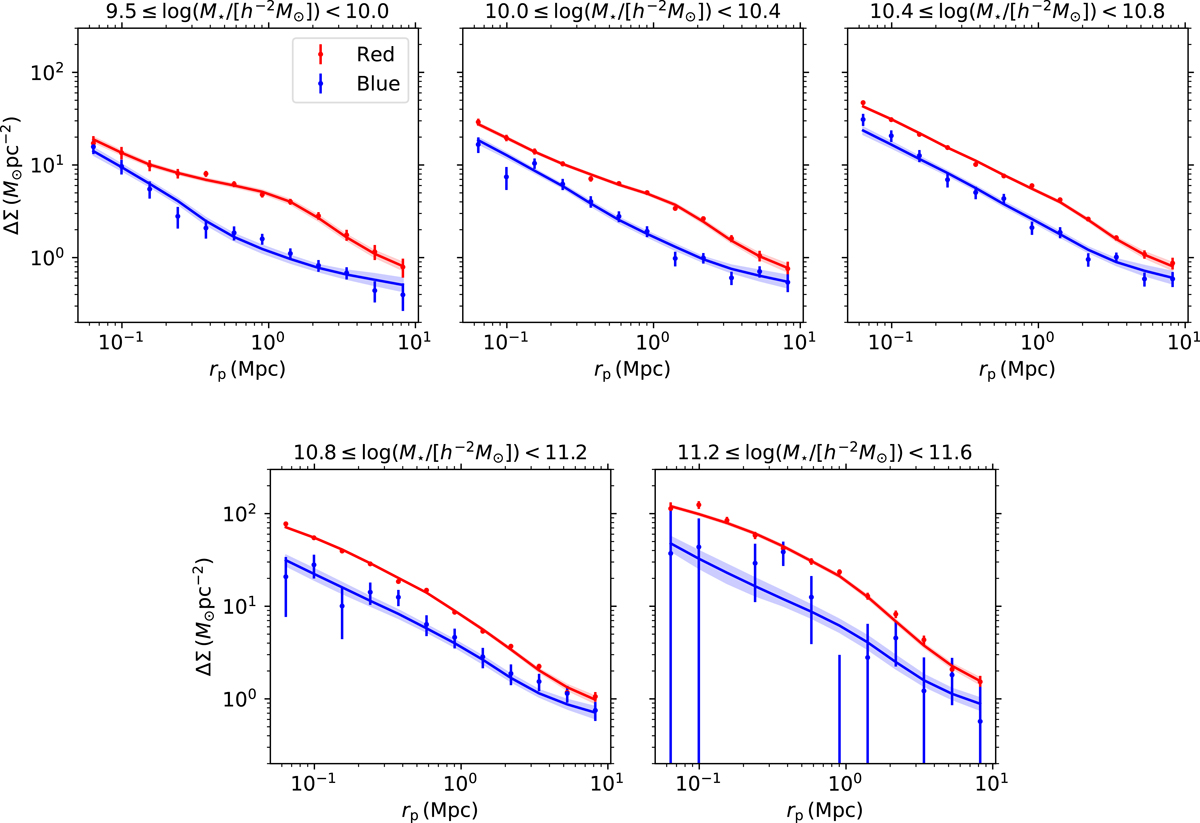
Fig. 8.
Download original image
Stacked excess surface density profiles, ΔΣ, of the red and blue lenses (points in corresponding colors) in our KiDS-Bright sample in the four stellar mass bins labeled at the top. The lines indicate the best-fitting halo model, with contributions from both centrals and satellites (red and blue lines with shaded bands enclosing the 68% credible intervals). We note that the model was fit to all stellar mass bins simultaneously, but separately for the red and blue populations.
Current usage metrics show cumulative count of Article Views (full-text article views including HTML views, PDF and ePub downloads, according to the available data) and Abstracts Views on Vision4Press platform.
Data correspond to usage on the plateform after 2015. The current usage metrics is available 48-96 hours after online publication and is updated daily on week days.
Initial download of the metrics may take a while.