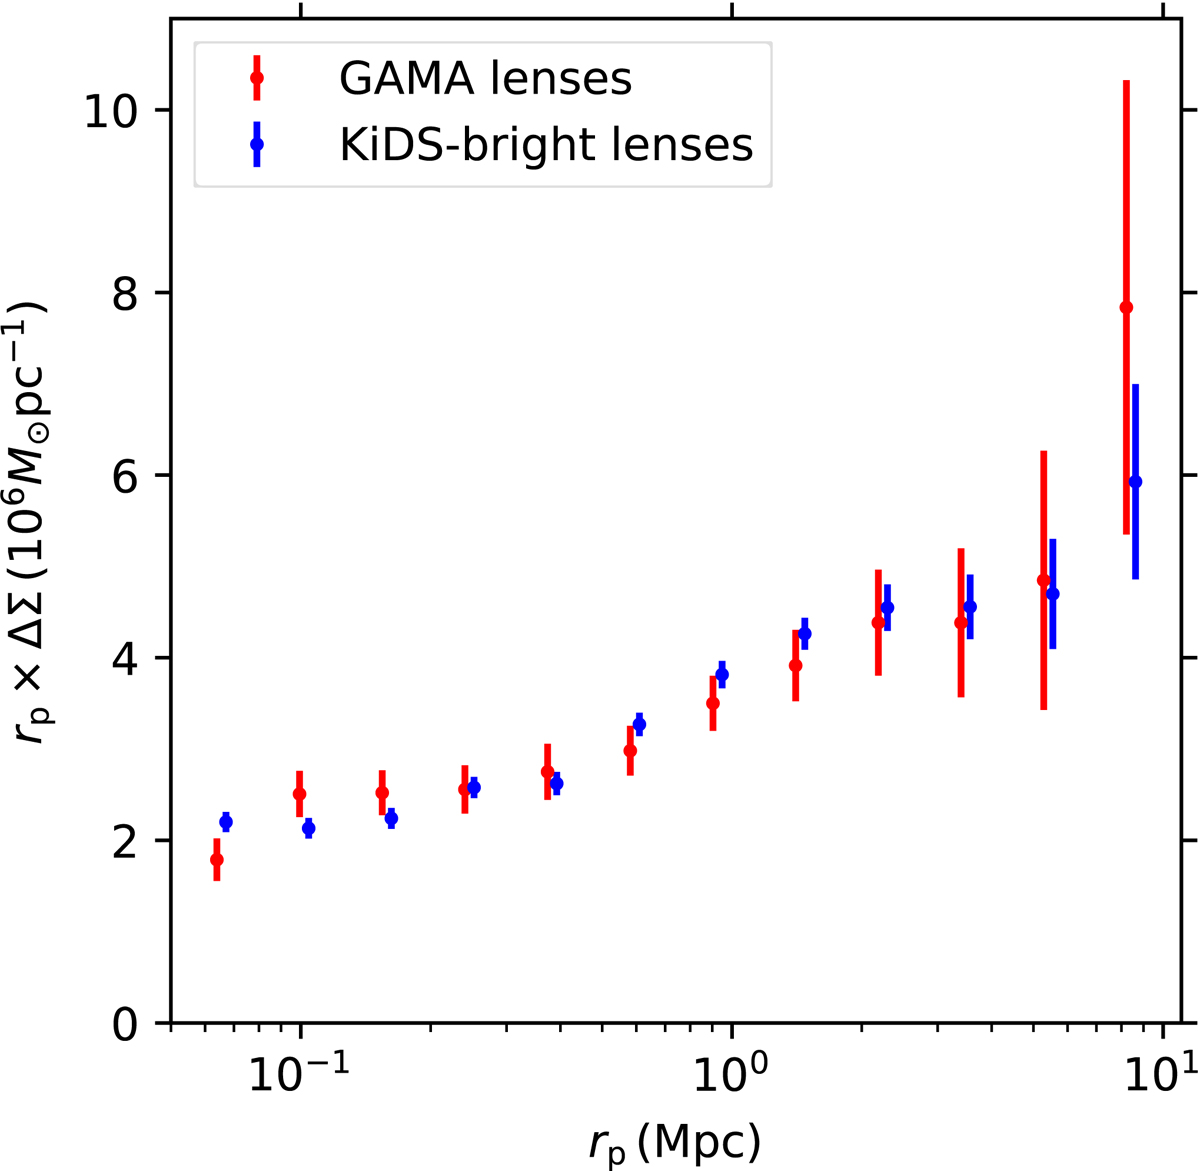
Fig. 7.
Download original image
Stacked excess surface density profiles, ΔΣ (multiplied by the distance from the lens rp in megaparsecs), around lenses with log(M⋆/M⊙) ∈ [10.5, 11.0]. The red points show results for 68 000 lenses selected from GAMA, whereas the blue points show the signal around 352 000 lenses from the KiDS-Bright sample. The KiDS measurements were shifted slightly to the right for clarity.
Current usage metrics show cumulative count of Article Views (full-text article views including HTML views, PDF and ePub downloads, according to the available data) and Abstracts Views on Vision4Press platform.
Data correspond to usage on the plateform after 2015. The current usage metrics is available 48-96 hours after online publication and is updated daily on week days.
Initial download of the metrics may take a while.