Fig. 5.
Download original image
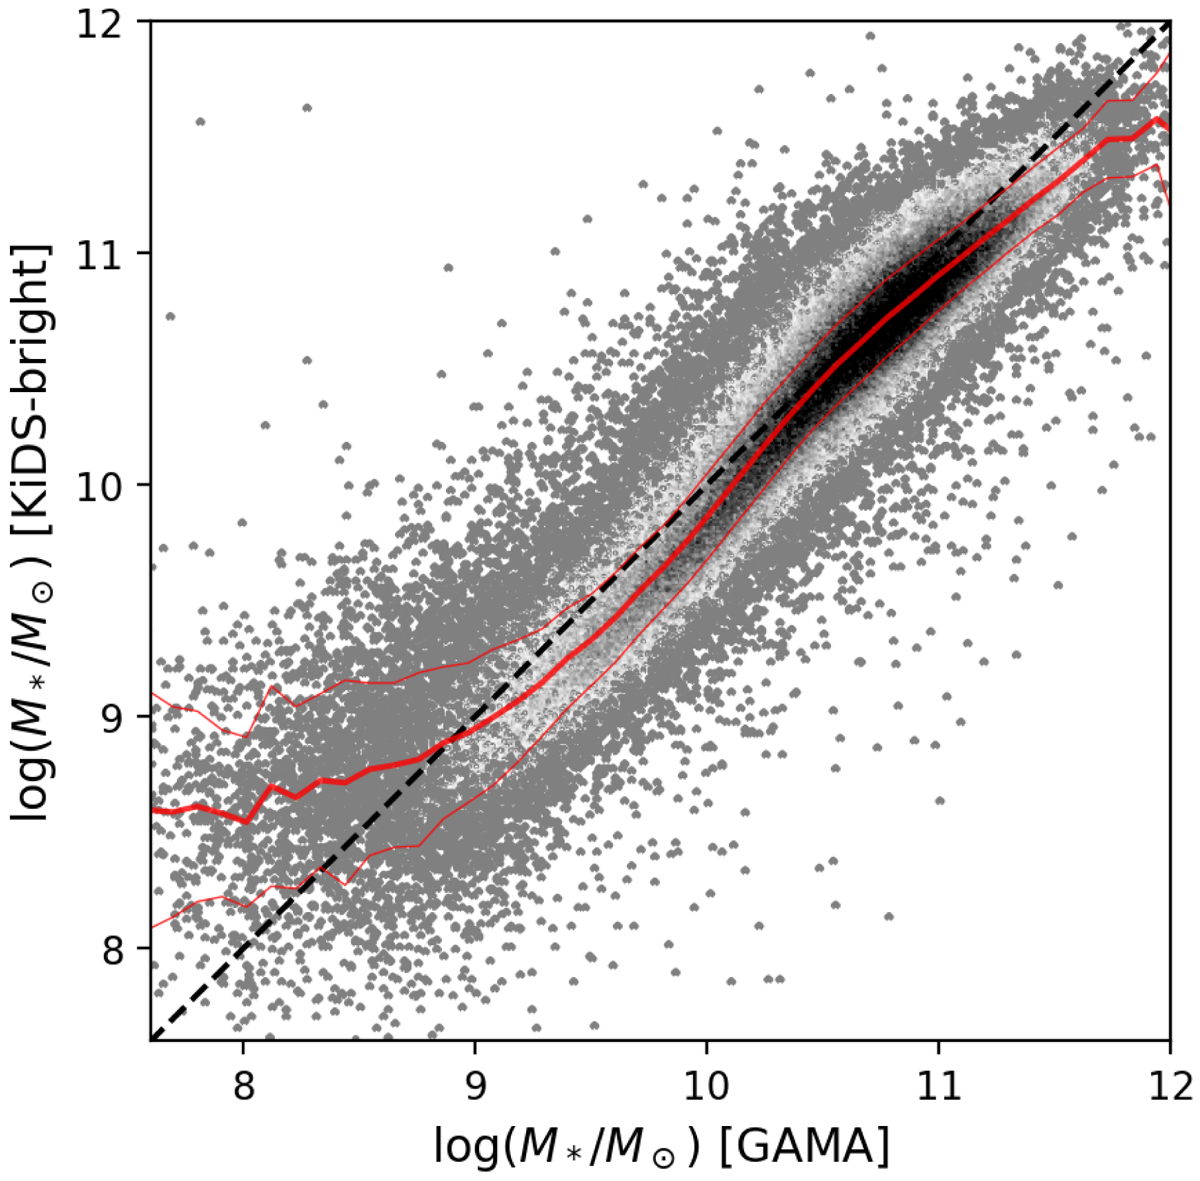
Comparison of the derived stellar masses between the photometric KiDS-Bright sample (this work) and the spectroscopic GAMA dataset for galaxies common to both catalogs. The light gray to black scaling illustrates the bulk of the sample, while the outliers where the number density is smaller, are shown with individual large gray dots. The thick red line is the running median, and thin red lines illustrate the scatter (SMAD).
Current usage metrics show cumulative count of Article Views (full-text article views including HTML views, PDF and ePub downloads, according to the available data) and Abstracts Views on Vision4Press platform.
Data correspond to usage on the plateform after 2015. The current usage metrics is available 48-96 hours after online publication and is updated daily on week days.
Initial download of the metrics may take a while.