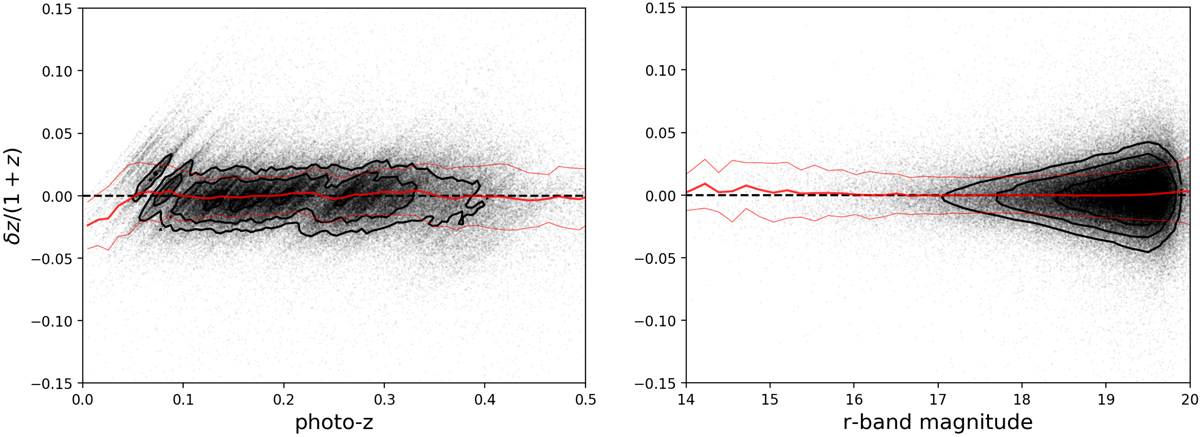
Fig. 3.
Download original image
Photometric redshift errors in the KiDS-Bright sample as a function of photo-z (left) and of the KiDS r-band AUTO magnitude (right), calibrated on overlapping GAMA data. Each dot is a galaxy, with contours overplotted in the highest number density areas. The thick red line is the running median and the thin red lines illustrate the scatter (SMAD) around the median. The stripes in the left panel originate from the large-scale structures present in the GAMA fields.
Current usage metrics show cumulative count of Article Views (full-text article views including HTML views, PDF and ePub downloads, according to the available data) and Abstracts Views on Vision4Press platform.
Data correspond to usage on the plateform after 2015. The current usage metrics is available 48-96 hours after online publication and is updated daily on week days.
Initial download of the metrics may take a while.