Fig. 2.
Download original image
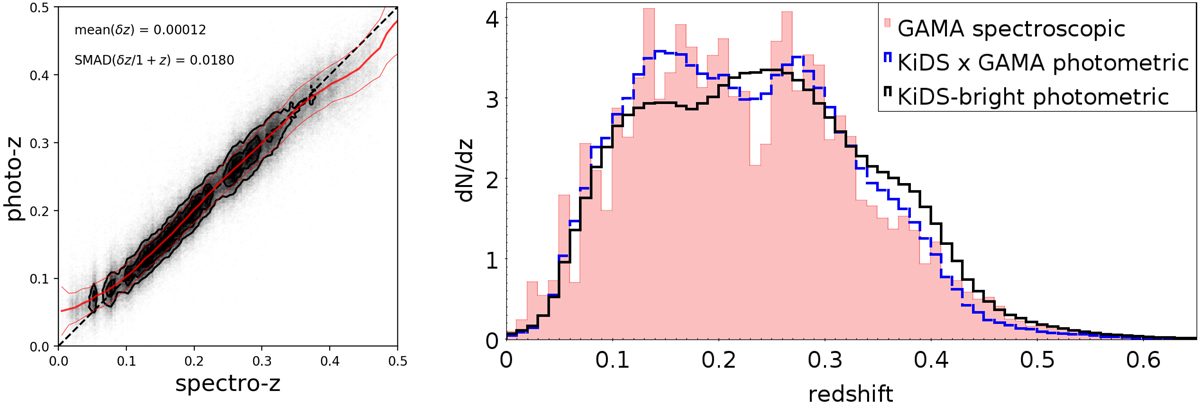
Comparison of the KiDS-Bright photometric redshifts with the overlapping GAMA spectroscopic data. Left: direct spectro-z – photo-z comparison. The thick red line is the running median of the function zphot(zspec) and the thin red lines illustrate the scatter (SMAD) around the median. The black dashed line shows the identity. Right: comparison of redshift distributions of the GAMA spectroscopic training set (red bars), photo-zs for the common KiDS × GAMA sources (blue dashed line), and the full KiDS-Bright photo-z sample (black line). The histograms are normalized to the unit area.
Current usage metrics show cumulative count of Article Views (full-text article views including HTML views, PDF and ePub downloads, according to the available data) and Abstracts Views on Vision4Press platform.
Data correspond to usage on the plateform after 2015. The current usage metrics is available 48-96 hours after online publication and is updated daily on week days.
Initial download of the metrics may take a while.