Open Access
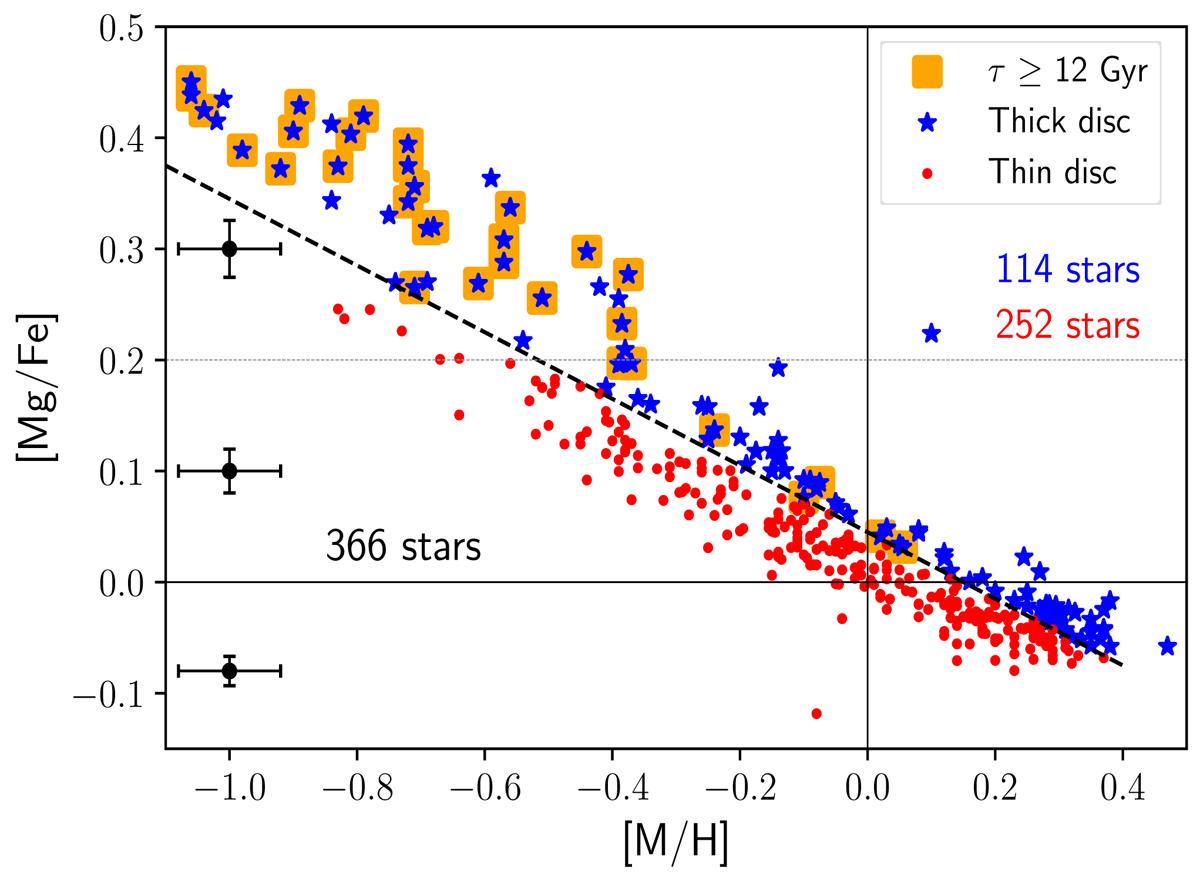
Fig. 3.
Download original image
[Mg/Fe] vs. [M/H] for our working sample. The stars with ages older than 12 Gyr are highlighted with orange squares. The black dashed line defines the thin(red circles)–thick(blue stars) disc chemical separation. The mean estimated errors are represented on the left-hand side for three different intervals in [Mg/Fe].
Current usage metrics show cumulative count of Article Views (full-text article views including HTML views, PDF and ePub downloads, according to the available data) and Abstracts Views on Vision4Press platform.
Data correspond to usage on the plateform after 2015. The current usage metrics is available 48-96 hours after online publication and is updated daily on week days.
Initial download of the metrics may take a while.