Fig. 11.
Download original image
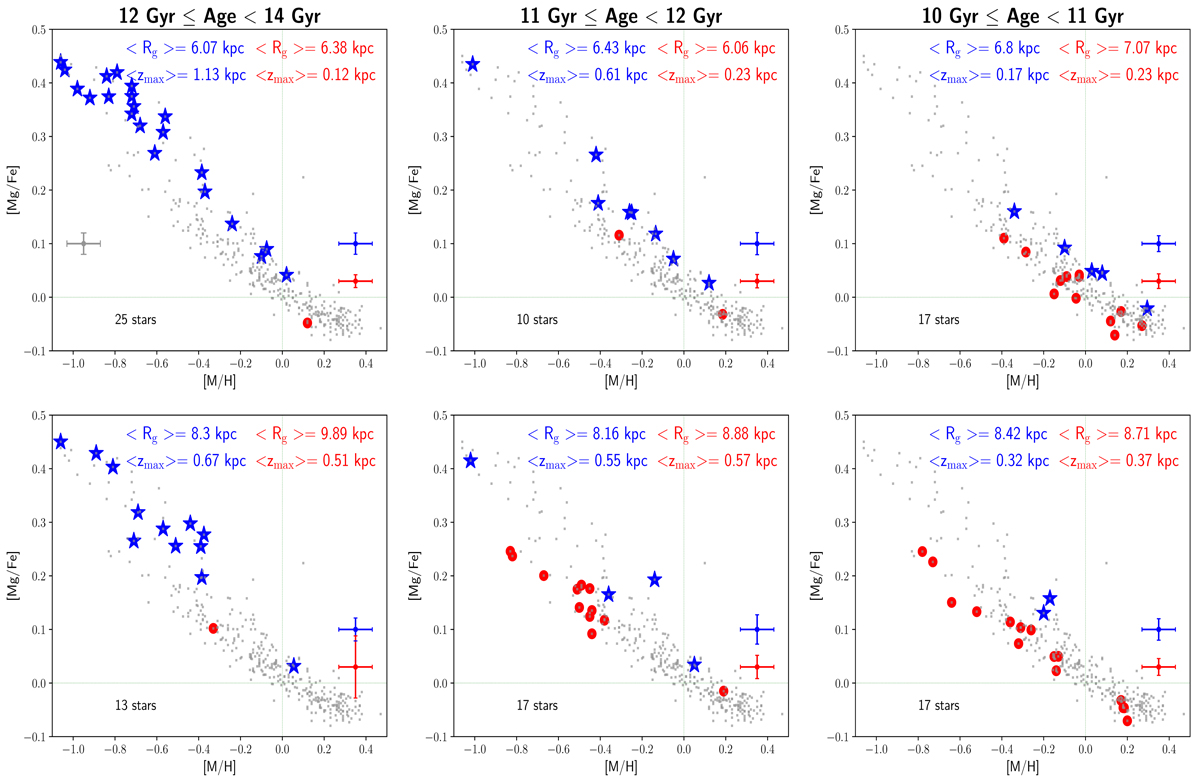
Distribution of the selected sample in the ([M/H], [Mg/Fe]) plane at different ages and locations in the Galaxy (Rg). Two chemical sequences appear for ages younger than ∼ 11–12 Gyr, corresponding to the classical thick (blue stars) and thin (red circles) disc components. Each panel corresponds to a bin in the (age, Rg) space, dividing the Galactic disc into two regions: inner (Rg ≤ 7.5 kpc; top row) and outer (Rg > 7.5 kpc; bottom row). The blue and red crosses in the bottom-right corner of each panel represent the mean estimated errors in [Mg/Fe] and [M/H] for the thick and thin disc population, respectively, at that particular radius and time. The average Rg and zmax for each population are given at the top of each panel. The whole working sample is shown by the dotted grey points.
Current usage metrics show cumulative count of Article Views (full-text article views including HTML views, PDF and ePub downloads, according to the available data) and Abstracts Views on Vision4Press platform.
Data correspond to usage on the plateform after 2015. The current usage metrics is available 48-96 hours after online publication and is updated daily on week days.
Initial download of the metrics may take a while.