Fig. 10.
Download original image
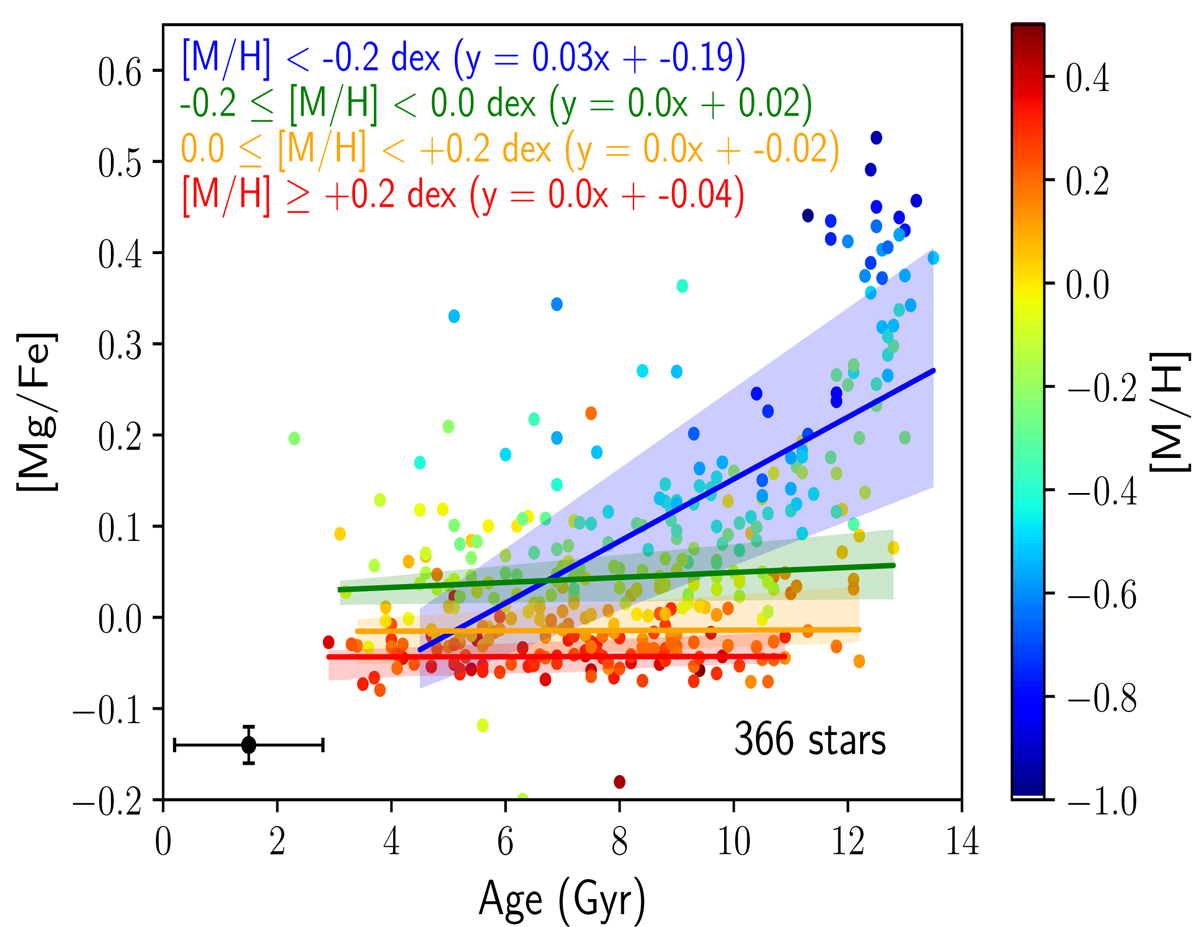
[Mg/Fe] as a function of age for the working sample. The coloured lines correspond to the Theil-Sen linear regression over different metallicity ranges, from metal-poor to metal-rich (from top to bottom). The respective shaded areas span the lower to upper bound of the 95% confidence interval of the fit. The mean estimated uncertainties for each star value are shown in the bottom-left corner.
Current usage metrics show cumulative count of Article Views (full-text article views including HTML views, PDF and ePub downloads, according to the available data) and Abstracts Views on Vision4Press platform.
Data correspond to usage on the plateform after 2015. The current usage metrics is available 48-96 hours after online publication and is updated daily on week days.
Initial download of the metrics may take a while.