| Issue |
A&A
Volume 653, September 2021
|
|
|---|---|---|
| Article Number | A4 | |
| Number of page(s) | 9 | |
| Section | Planets and planetary systems | |
| DOI | https://doi.org/10.1051/0004-6361/202038742 | |
| Published online | 31 August 2021 | |
Dynamical effect of the 9:16 resonance with Mars on some Datura asteroids, including the pair Balam and 312497
1
Mathematical Institute, Slovak Academy of Science,
Bratislava,
Slovakia,
e-mail: This email address is being protected from spambots. You need JavaScript enabled to view it.
, This email address is being protected from spambots. You need JavaScript enabled to view it.
2
Research and Educational Center “Nonlinear Dynamics”, Yaroslavl State University,
Yaroslavl,
Russia
e-mail: This email address is being protected from spambots. You need JavaScript enabled to view it.
Received:
24
June
2020
Accepted:
20
May
2021
Abstract
Context. We studied the effect of the mean motion 9:16 resonance with Mars (9:16M) on the dynamics of the very young asteroid family Datura and the young pair (3749) Balam and (312497) 2009 BR60.
Aims. We aim to understand the mechanism of dynamical interaction of the members of a family that are subjected to mean motion resonance in order to precisely estimate the age of an asteroid family or pair and to reconstruct their breakup processes.
Methods. We calculated the expected (9:16M) resonance position, its boundaries, and multiplet fine structure and their time evolution under the effect of Mars orbit variations. We used the Lyapunov characteristic exponent and Euclid algorithm in our analytical calculations. We compared these results with backward numerical integrations of some Datura asteroids to check for consistency.
Results. We explain the strong variations in the semi-major axis of some Datura asteroids as caused by the variations in the orbit of Mars. Using the Datura family as an example, we show that the distance from resonance may be a better measure of chaos than the widely accepted Lyapunov exponent. Additionally, we find that asteroid (3749) Balam exhibits the conspicuous effects of dynamical perturbations that are likely induced by the 9:16M resonance.
Conclusions. Focusing on one of the most robust and well-established young asteroid families, the Datura family, we show that mean motion resonances play an important role as drivers of the dynamical evolution of asteroid families.
Key words: chaos / minor planets, asteroids: individual: Datura family / minor planets, asteroids: individual: Balam/2009 BR60 / celestial mechanics
© ESO 2021
1 Introduction
Hirayama (1918) was the first to identify concentrations of asteroids with very similar orbital elements that are known today as asteroid families. They are intensively investigated because they provide unique possibilities for studying different processes related to high-energy collisions. According to Nesvorný et al. (2015), more than 120 asteroid families are currently known. A summary of the current state of affairs in the field of asteroid family identification is given in Michel et al. (2015).
Most of the large asteroid families are at least 1 Gyr old (Milani et al. 2017; Carruba et al. 2016). The dynamic history of old asteroid families is affected by a number of limiting factors, such as incomplete data on the Yarkovsky effect, chaos effect, and subsequent collisions (Marzari et al. 1999; Nesvorný et al. 2006), which make reconstructing their dynamical past difficult. The Yarkovsky–O’Keefe–Radzievskii–Paddack (YORP) effect (Carruba et al. 2016) and the chaotic scattering by relatively large trans-Neptunian objects affecting the older families (Galiazzo et al. 2016) may contribute to complicate the already difficult task of estimating their dynamical age even more. The younger an asteroid family, the more straightforward the analysis because the members of such a family only represent the outcome of the process of fragmentation of their parent body prior to the subsequent dynamical and physical changes induced by the orbital and physical evolutionary processes acting over time.
The study of young asteroid families has become a subject of significant interest within the field (see e.g. Pravec et al. 2018). Recent studies have shown that some asteroid families can also be the outcome of the spin-up-induced fission of a critically rotating parent body (fission clusters), see Jacobson & Scheeres (2011). Moreover, cases of subsequent breakups can take place in older families (Carruba et al. 2020). In this paper, we target the effect of the mean motion resonances on changing the semi-major axis of family members and pairs. We focus on the Datura asteroid family because it is well known (Nesvorný & Vokrouhlický 2006) and is very close to the 9:16 mean motion resonance with Mars. Another very interesting young asteroid family is the newly discovered Adelaide family (Vokrouhlický et al. 2021). This family is located near the Datura family region, and future study could be very informative. As a secondary case study, we used the young pair Balam and 2009 BR60.
In all instances we refer to standard notations for orbital elements. a is the semi-major axis in AU, e is the eccentricity, i is the inclination, Ω is the longitude of the ascending node, ω is the argument of perihelion,  is the longitude of perihelion, which is
  (see e.g. Murray & Dermott 2000). The angular elements are given in degrees. In general, analytic proper orbital elements are based on the solution of averaged equations of motion, and synthetic proper orbital elements are based on the numerical integration results.
We integrated the equations of motion of the systems numerically 800 kyr into the past to study the dynamical evolution of asteroids using the N-body integrator Mercury (Chambers 1999) and the Everhart integration method (Everhart 1985). We used a time-step of one day and an accuracy parameter of 10−18 in our integrations. Considering that the age of the Datura family was estimated in the range of 400–500 kyr (Vokrouhlický et al. 2008), we restricted ourselves to a time interval of integration of 800 kyr.
We used three integration cases in this research. In the first case, we only took into account disturbances from major planets (onlyplanet). In the second case, we added disturbances from Ceres, Vesta, Juno, and Pallas (CVJP). In the third case, we added disturbances from all previous celestial bodies plus Hygiea, Eunomia, Interamnia, and Davida (CVJPHIDE). We retrieved the data used as initial orbital elements from the JPL Horizons website1. For the masses of large asteroids, which are not published in JPL Horizons, we used the values of masses calculated by the technique ofastrometric mass determination (Baer & Chesley 2008). Table 1 shows the elements of the asteroids discussed in this paper.
We used the preliminary results from Rosaev & Plávalová (2018) as a basis and calculated the values of new numerical integrations.We report on the importance of studying weak effects on the evolution of asteroid orbits, especially the 9:16 resonance ofMars. We organise the sections as follows: The main information about the Datura family is given in Sect. 2. In Sect. 3 we discuss the Lyapunov characteristic exponent (Sect. 3.1) and then determine the resonance position with the Euclid algorithm (Sect. 3.2). We explain our considerations on resonance boundaries in Sect. 3.3 and compare our calculation for the Mars orbit with those of Laskar et al. (2002) results in Sect. 3.4. We propose a simple theoretical model in Sect. 4 and discuss the effect of the large asteroid perturbations on the Datura family members in Sect. 5. We evaluate the degree of the relevance of the Yarkovsky effect on changing the orbits of asteroids (Sect. 6). As another example in which the 9:16 resonance with Mars could be visible, we introduce the pair 3749 Balam and 2009 BR60 in Sect. 7, and finally, we offer our conclusions in Sect. 8.
Osculating orbital elements of the Datura family members at epoch 2 451 000.5 = AD 1998-Jul-06 00:00.
2 Datura family main facts
The group of minor planets associated with the largest body of (1270) Datura is a young asteroid family. Since its discovery by Nesvorný et al. (2006), both its dynamical evolution and physical properties have been rigorously studied. Vokrouhlický et al. (2008) first postulated that the formation of the Datura asteroid family took place nearly 450 kyr ago. They modelled the dust distributions after the Datura breakup. The Datura family consists of one large 10 km-sized asteroid (parent body) and a few small minor planets, possible fragments resulting from a catastrophic breakup. Until recently, only seven members of the Datura family were known (Nesvorný et al. 2006, 2015; Vokrouhlický et al. 2009), all of them belonging to the so-called S-type of minor planets (Tholen 1984). According to our latest analyses (Rosaev & Plávalová 2017), however, three new members have to be included, and Vokrouhlický et al. (2017) have reported on the existence of another seven. The total sum of known members of the Datura family might therefore be as high as 17 at the time of writing (see Table 1). The obvious question is whether all of these 17 members are the product of a single breakup event or if some of them were brought into existence by subsequent fragmentations. Fatka et al. (2020) introduced the idea of cascade disruptions of some asteroid families.
3 Problem setting
Nesvorný & Vokrouhlický (2006) pointed out that the Datura family is very close to the 9:16M mean motion resonance with Mars. Vokrouhlický et al. (2017) provided a detailed analysis of this resonance in the terms of relative velocity. In particular, they noted that three Datura members, (89309) 2001 VN36, (433382) 2013 ST71, and (485010) 2009 VS116, are currently located in this resonance. We consider some other aspects of the interaction of some Datura members with this resonance and offer qualitative explanations of some observed features.
Vokrouhlický et al. (2017) noted that one member, (452713) 2005 YP136, even appears to jump over this resonance, accumulating a large perturbation in its proper orbital elements. In our previous work, we outlined this jump in the orbit of 2014 OE206 (Rosaev & Plávalová 2017). According to the results of backward integrations when Ceres and Vesta perturbations were taken into account, a further three members (2009 VS116, 2001 VN36, and 2011 KT10) have exhibited a similar behaviour (Rosaev & Plávalová 2018). The qualitative explanation of these jumps is the main goal of our present paper.
To study the dependence of the results on initial data variations, we repeated the integration with a limited number of clones within the 1σ interval for three selected members of the Datura family, namely (89309) 2001 VN36, (485010) 2009 VS116, and (485010) 2009 VS116 (Table 2). We excluded 2014 OE206 from our consideration because its orbit is poorly determined. We used six clones for each orbital element: six clones for eccentricity, six clones for orbital inclination, etc. We can accurately describe the most recent (closest in time) encounter and more or less describe the secondary encounter, but beyond this, we can only give a range of possible orbits. In the same way, we can provide a detailed description of the most recent interaction of the orbit of an asteroid with resonance, more or less plot the interval between first and second approach with resonance, but after this, we can only give a range of possible orbits.
Moreover, the question of the interaction between the orbit of an asteroid with resonance cannot be studied by classical statistical methods because the results of the second approach might be higher or lower than the nominal value of resonance with the comparable possibility (Fig. 1). The distribution is therefore expected to be bimodal. Surprisingly, the uncertainties on inclination, eccentricity, node, and perihelion longitudes have a greater effect on the asteroid orbits we studied than the uncertainties on mean anomaly and semi-major axis.
Uncertainties of orbital elements of the Datura family members (1σ interval) from the JPL Small-Body Database Browser.
3.1 Lyapunov characteristic exponent
Evidently, the 9:16M is a high-order resonance (7th order) with apparently little strength (Murray & Dermott 2000). However, it has a great influence on the Datura orbits, forcing semi-major axis changes and sometimes moving asteroids from one side of the resonance to the other.
To understand the stability of the Datura family orbits, we employed the Lyapunov characteristic exponent (LCE) on the proper semi-major axis dependence (see e.g. Skokos 2010). LCE measures the mean exponential rate of the divergence of nearby trajectories. The data source that we used for our calculations is from the AstDys website (Knežević & Milani 2003) shown in Table 32.
The distributions of LCE built on analytic and synthetic values of the proper semi-major axis differ (see Fig. 2). Even so, a gap can easily be seen, in which relatively few points lie, and this gap is similar to the values of the 9:16M resonance borders.
The differences of the LCE values for the analytic and synthetic semi-major axis may be related to the difference in the time span used inthe calculations, which in synthetic proper elements is 2 Myr. This is greater than the time span used in analytic values. However, we note that for very young asteroid families such as the Datura family, analytic values appear to be more precise; the 9:16M resonance cause the gap in the distribution of the Datura family members by the proper semi-major axis, both in analytic and synthetic values. Some asteroids are on opposite sides of the resonance, meaning that a quantitative analytical study of 9:16M is difficult. Based on the results shown in Fig. 2, we can conclude that the orbits with very close values of their proper semi-major axes (with a difference of about 10−5 AU) display a large difference in their orbital stability (in Lyapunov time).
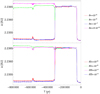 |
Fig. 1 Evolution of the orbit of (89309) 2001 VN36 depending on the initial variations in orbital elements. The dynamical evolutions of the orbit as a function of the eccentricity and inclination are shown in the upper graph, and the node and perihelion longitude variations are shown in the lower graph. |
3.2 Determining the resonance position with the Euclid algorithm
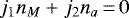
To understand these dependences better, we applied the so-called Euclid algorithm of resonance (Subbotin 1968). For a simple mean motion resonance,
 (1)
(1)
is valid, where nM, na is the mean motion of Mars and the asteroid,respectively, and j1, j2 are the integers.
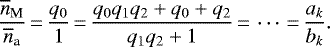
It has long been established that a long-period term of perturbation (so-called small divisors case) can have a noticeable amplitude only when j1 and j2 have low absolutevalues. The most straightforward way to find these values is to use the decomposition of the averaged mean motion ratio nM ∕na into a continued fraction,
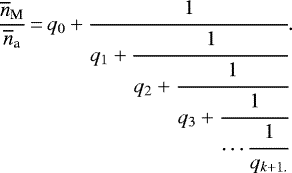 (2)
(2)
To determinate values of qk, we used the Euclid algorithm,
 (3)
(3)
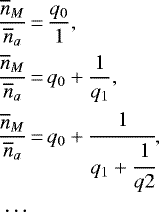
resulting in
 (4)
(4)
The period of perturbation (P) increases due to the approach of resonance,
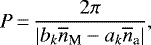 (5)
(5)
and it can be considered as an additional criterion to determine the resonance acting on a minor body. This conclusion is true for the pendulum model of libration at resonance: the period increases as a result of approaching the separatrix. The amplitude of perturbation in linear theory is proportional to
 (6)
(6)
however, it is not true in the non-linear approach because the period tends to infinity when an exact resonance is reached, but in reality, the amplitude always stays finite. Subbotin (1968) showed that when the motion of two planets is studied under the influence of their mutual attraction, it is only necessary to account for one small divisor.
The location of the 9:16M resonance as given by Vokrouhlický et al. (2017) is 2.2359 AU. When we apply the more precise value aM = 1.523679338 AU for the semi-major axis of Mars, we reach a value of ar = 2.23603 AU for the centre of this resonance and nr = 1061.199 arcsec day−1 for the mean motion. According to our numerical integration results, the centre of the chaotic zone (measured as half the sum of the upper and lower boundaries) is about 2.23585 AU. We calculate the distance from resonance (resonance Δ = na − nr arcsec day−1) and resonance period (Table 3).
According to our own findings, the stability can be better characterised by the resonance period and the distance of the body from the resonance than by the LCE in this particular case, as they are clearly affected by the chaotic nature of the dynamical evolution of 2001 VN3 (Nesvorný et al. 2006). This fact is well supported by the results obtained in the numerical integrations. Otherwise, the LCE leads to the false impression that the dynamical behaviour of 60 151 1999 UZ6 and (90265) 2003 CL5 is more unstable than the dynamical evolution of 2001 VN36.
Estimates of the relative resonance positions of the Datura asteroids.
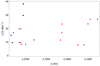 |
Fig. 2 Lyapunov characteristic exponent (LCE) for the members of the Datura family. The analytic semi-major axis dependence is shown as red dots, and the synthetic semi-major axis dependence is shown as blue squares. |
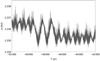 |
Fig. 3 Evolution of the semi-major axis of 2014 OE206 close to 50 kyr ago. |
3.3 Resonance boundaries
The resonance boundaries given by Vokrouhlický et al. (2017) are 2.2355 < ar < 2.2363 AU. They coincide with the unstable area in the analytic semi-major axis (Fig. 2). For the synthetic semi-major axis, we have the interval value of 2.2350 < ar < 2.2357 AU (Fig. 2). In our previous work (Rosaev & Plávalová 2018), we gave an estimate of 2.23485 < ar < 2.23505 AU for the unstable zone. Consistently, the value ar = 2.23485 AU may be interpreted as the left boundary of the resonance in the synthetic semi-major axis. Rosaev & Plávalová (2018) discussed the jumps of some asteroids from one side of resonance to the other. A detailed picture of one of such jump is given in Fig. 3. Prior to the occurrence of the jump, the oscillation of the semi-major axis acquires a large amplitude. After showing two peaks, the value of the semi-major axis becomes more stable and reaches a new lower level. This effect may be crucial in our understanding of the process to reconstruct the origin of the Datura family. However, we focused on the details of these resonance jumps and tried to explain the reason for them.
It would be natural to assume that the position and width of the resonance changes with time. We tested several possible scenarios to account for this. First of all, we considered the main observational fact: all members of the Datura family were affected by strong perturbations in semi-major axis at the same two epochs, about 50 and 310 kyr ago (Fig. 4). This allows us to assume that the reason for the chaotic dynamical behaviour affecting the Datura family are the orbit variations of Mars. To study this problem, we analysed the orbit of Mars. We observed that the semi-major axis of Mars carries no noticeable secular variations in the considered time interval 0–800 kyr, and so this factor may be excluded. However, the inclination and proper frequency of the node longitude of Mars have strong variations. Because they occurred about 50 kyr and 310 kyr ago, they are the most logical reason for the jump in the values of the semi-major axes of the Datura family members.
During the interval − 800 kyr < t < −310 kyr, the value of the change rate in the node longitude of Mars changed by an average of 0.0048 deg yr−1. However, in the interval −310 kyr < t < −50 kyr, we observe strong chaotic variations in the node rate of Mars; in some intervals,  changed sign (Fig. 5). These variations closely correspond with the semi-major axis variations for some members of the Datura family.
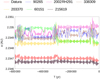 |
Fig. 4 Dynamical evolution of the semi-major axis of Datura family members, illustrating jumps close to 50 and 310 kyr ago. |
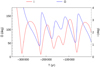 |
Fig. 5 Evolution of the node longitude (red line) and inclination (blue line) of the Mars orbit close to 60 kyr ago. |
3.4 Comparison of the results of our calculations for the Mars orbit with results of previous calculations
To assess the reliability of the results obtained in this work, we compared our integration results with a classical Mars orbit eccentricity evolution (Laskar et al. 2002). The difference increased with time and reached 10% by the end of the integration interval (800 kyr). This might be explained by the fact that we neglected some perturbations in our calculations, such as those due to relativistic effects (Fig. 6). This discrepancy beyond 450 kyr is noticeable, but considering the age of the Datura family, we can ignore it, although the remaining data until present time (− 450–0 kyr) agree closely with the classical results of Laskar et al. (2002).
4 Simple theoretical model
The effect of splitting the resonance at a high precession rate is well known (see e.g. Morbidelli 2002, and references herein). In general, it leads to chaos due to overlapping neighbouring resonances (Chirikov 1979). However, the outcome is always unique and requires careful consideration in each case. The general form of a resonance argument is (Murray & Dermott 2000)
 (7)
(7)
Here λM, λ are the mean longitudes,  is the perihelion, and ΩM, Ω are the node longitudes of Mars and the asteroid,respectively. j1...j6 are integer number coefficients and valid only if
  .
.
The reach of the exact 9:16M resonance takes place within a very short time interval. In Fig. 7, we present an example of the resonance argument (7) for the evolution of one of the clones of (485010) 2009 VS116. In the interval around 320–300 kyr ago, when the jump of the semi-major axis took place, we have the libration of resonance argument. Soon after, in the interval 300–290 kyr ago, we have a chaotic behaviour as opposed to the behaviour found in other intervals, in which a circulation of the resonance argument can be seen.
As is well known (e.g. Murray & Dermott 2000; Morbidelli 2002), each mean motion resonance can be split into several resonances. For the so-called e-resonances and i-resonances, the arguments are
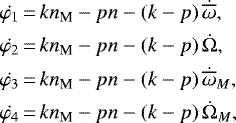 (8)
(8)
in the general view,
 (9)
(9)
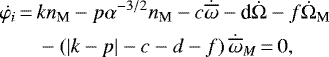
where k and p are integers and ∣ k − p∣ is the resonance order (in this paper, 16 − 9 = 7),
 (10)
(10)
and α is represented as
![Mathematical equation: \begin{align*}\alpha_{cdf}&\,{=}\,\left(\frac{p}{k}- \right.\nonumber \\&\left. -\left[c\dot{\overline{\omega}}+d\dot{\Omega}+f\dot{\Omega}_M +\left(\vert k-p\vert-c-d-f\right) \dot{\overline{\omega}}_{\textrm{M}}\right] /\left(kn_{\textrm{M}}\right) \right) ^{-2/3},\end{align*}](/articles/aa/full_html/2021/09/aa38742-20/aa38742-20-eq16.png) (11)
(11)
and for the 16:9 resonance,
![Mathematical equation: \begin{align*}\alpha_{cdf}&\,{=}\,\left(\frac{16}{9} \right.\nonumber \\&\left. \quad-\left[c\dot{\overline{\omega}}+d\dot{\Omega}+f\dot{\Omega}_{\textrm{M}} +\left(7-c-d-f\right) \dot{\overline{\omega}}_{\textrm{M}} \right] /\left(9n_{\textrm{M}} \right) \right) ^{-2/3},\end{align*}](/articles/aa/full_html/2021/09/aa38742-20/aa38742-20-eq17.png) (12)
(12)
where n and nM represent the mean motions of an asteroid and Mars. Equation (11) is indicative in the case of arbitrary resonances. The derivatives in Eq. (11) can be calculated analytically or by numerical integration results. Here we use the second method to compute them.
The distances between these resonances are very small, therefore we can consider them as a single resonance in which the width (and position) varies slowly with time. The positions of resonances ar = αcdfaM calculated by Eq. (12) are given in Table 4, where the common width of the resonance multiplet is given in the last column. When the rate of change of the node longitude of Mars  changes at about 310 kyr and 50 kyr, the commonwidth and position of the centre of the resonance zone also change.
In the considered time interval, the averaged semi-major axis of Mars is 1.523679338 AU, and accordingly, the mean motion is 191.4089028 deg yr−1. The proper frequencies for the Datura asteroid family are  deg yr−1,
  deg yr−1 and remain approximately constant, but the node precession rate of Mars is strongly unstable in the time interval 50–310 kyr ago (Fig. 5). However, in the remaining time interval from 310 kyr, this variation appears to be different, and we can represent it as an increasing line with a value that changes in circulation.
In the time interval −800 kyr < t < −310 kyr, the value of the change rate in the node longitude of Mars is about  deg yr−1, and the position of the centre of resonance varies with time until it reaches a value of 2.236029 AU. However, in the time interval −310 kyr < t < −50 kyr, the nodal rate of Mars varies strongly and chaotically. In some intervals where
  changes between positive and negative values, the average value of
  and the resonance position is 2.236052 AU (Fig. 5). According to the results obtained in backward numerical integrations, approximately 50 kyr ago, we calculated the value
  deg yr−1 and the centre of the resonance returned to 2.236029 AU. This shows a shift in the resonance position of about 0.00001 AU. Although apparently insignificant, this shift is sufficient to change the conditions of the dynamical interaction of some members of the Datura asteroid family that are in 9:16 M resonance. The centre of the resonance position is always greater than the integration value (2.2359 AU), that is, the chaotic resonance zone shifts towards the perturbing planet.
As a result of these shifts, the boundaries of the resonance change with time (within a range of about 0.00003 AU). This is comparable with the difference in proper semi-major axis between stable and unstable orbits of the Datura family (Fig. 2) and might initiate an approach to the resonance for asteroids of similar semi-major axis. Similar values of semi-major axis are clearly necessary, but this is not the only condition. According to the Yoder diagrammatic model of resonance crossing (Yoder 1979), we can say that because of the short periodic variations of asteroids and Mars semi-major axis, jumps can take place in a narrow range of the resonance argument phase. Simultaneously, a capture in resonance can likewise take place, but this is a rarity.
As an example, approximately 50 kyr ago, the semi-major axis of the centre of the resonance decreased and the orbit of 2014 OE206 came close to the resonance. This was captured in resonance, but only for a very short time, about 2 kyr (see Fig. 3). After this, the orbit of 2014 OE206 obtained a new value of the semi-major axis beyond that of the resonance; that is, 2014 OE206 jumped from one side of the resonance to the other. For the same reason, the orbits of (89309) 2001 VN3 and 2014 OE206 had to take time to adjust to the orbital changes of Mars.
In Table 4, the position of the centre of the resonance appears to be able to move away from the Sun as well as towards it. This means that each epoch of resonance position carries an instability in both directions of the jump, depending on the phase of the resonance.
Not all features of the dynamics of the Datura family members can be explained in this way. This is the case of the dynamical behaviour that corresponds to the intervals close to 220 kyr, where no jumps are found. This can be explained by taking into account that other orbital elements of Mars (mainly the orbital eccentricity) play a role in the complete theory. However, despite the inherent complexity of the resonance phenomenon in the complete theory, some relevant features of the orbits in the vicinity of the 9:16M resonance might be clearly understood with the help of the simple model used here.
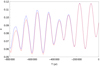 |
Fig. 6 Evolution of the Mars orbit eccentricity using our results (red line) compared with the integration (blue line) by Laskar et al. (2002). |
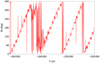 |
Fig. 7 9:16M resonant argument for a representative clone of (485010) 2009 VS116. |
9:16M resonance positions and widths related to the node rate variations of Mars.
5 Effect of the large asteroid perturbations on the Datura family members
In our previous work (Rosaev & Plávalová 2017) devoted to the Datura asteroid family, all the results were obtained by integrating a model solar system that only included the eight major planets and Pluto. However, Carruba et al. (2016) and Novaković et al. (2016) have argued that the dwarf planet Ceres and the large main belt asteroids Vesta, Juno, and Pallas may have a remarkable effect on the gravitational perturbations affecting other smaller members of the main belt, such as the asteroids that belong to the Datura family.
Using these new data, our numerical integrations use a more complex solar system model that includes the dwarf planet Ceres and the large asteroids Vesta, Juno, and Pallas as additional massive perturbers. As a consequence of using this new model, our main results have changed significantly, in particular, we observe a behaviour similar to that of 2014 OE206 in the semi-major axis of other members of the Datura family, namely 2001 VN36 and 2011 KT10. The Ceres and Vesta perturbations triggered an effect that destabilized the orbit of 2001 VN36 (Fig. 8) and 2011 KT10 (Fig. 9). We can conclude that the effect of Ceres on the dynamics of the Datura family is quite significant and cannot be neglected.
We note that Ceres and Vesta perturbations extend the boundaries of the resonance-related chaotic zone. As we stated in a previous paper (Rosaev & Plávalová 2017), 2014 OE206 can jump from one side of the resonance to the other through the effect of planetary gravitational perturbations alone.
However, when we take the Ceres and Vesta perturbations into account, some other members of the Datura family exhibit a similar behaviour. In particular, 2001 VN36 jumps from one side of 9:16M resonance to the other under perturbations from Ceres (Fig. 8). Similarly, asteroid 2011 KT10 jumps through the resonance when we take perturbations by Ceres and Vesta into account (Fig. 9). We also note a similar effect in the semi-major axis of 2006 SD382.
A possible explanation for the Ceres and Vesta effect is that the perturbations from Ceres and Vesta might slightly increase the mean semi-major axis of the Datura family asteroids, moving them closer to resonance. This shift in the values of the semi-major axis is sufficient to initiate strong resonance perturbations in their orbits.
The direct or indirect effect of large asteroids (Juno, Pallas, Hygiea, Eunomia, Interamnia, and Davida) on some Datura family members became evident when we compared the integration results. It is an indirect effect as a consequence of the orbital changes of Mars. The cumulative effect of Ceres, Vesta, Juno, and Pallas on the evolution of the orbital angular elements of Mars crowds out the effect of the other large asteroids (Hygiea, Eunomia, Interamnia, and Davida), making their effect pale into insignificance (see Fig. 10). We recall, however, that during a time of great instability in correlation with the orbital variations of Mars (310, 180, and 50 kyr ago), even the smallest, almost negligible perturbations could alter the character of the orbital evolution of the asteroids mentioned above (Fig. 8).
6 Yarkovsky effect on the resonance
Non-gravitational forces such as the Yarkovsky effect can significantly affect the interaction of asteroids with resonance. The Yarkovsky effect can change the value of the semi-major axis and shift an asteroid away from or towards the Sun. It can increase or decrease the semi-major axis of an asteroid, depending on the axial rotation of the asteroid.
Unfortunately, the parameters of the Yarkovsky effect for the smaller members of the Datura family are poorly understood. We can only estimate the maximum values. Applying the assumption that the rotation axis of all asteroids is colinear and the bulk density is p = 1.1 g cm−3, we can normalise the maximum effect using the data of Spoto et al. (2015) for asteroid Bennu. The details of the method we employed are described in our previous study (Kuznetsov et al. 2019), from which we obtained the maximum effect value for semi-major axis ȧ ≈ ± 5 × 10⁻⁴ AU Myr−1 for the bodies we targeted.
These values are enough to move an asteroid inside or outside of the resonance area throughout the estimated lifetime of the Datura asteroid family (450 kyr). Our numerical integrations have shown that the jumps in the semi-major axis of 2001 VN36 and 2009 VS116 about 50 kyr ago displayed a wide range of assumed Yarkovsky parameters. We can conclude that studying the Yarkovsky effect is very important (potentially absolutely necessary) to understand the origin of the Datura family, but in order to provide a proper and more accurate study of this effect, new observations are required to improve the knowledge of the Yarkovsky parameters in this particular case.
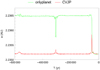 |
Fig. 8 Evolution of the semi-major axis of 2001 VN36 in two different integration cases. The upper green line represents only the planetary perturbers (onlyplanet), and the lower red line additionally shows the perturbers Ceres, Vesta, Juno, and Pallas (the CVJP integration case). |
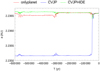 |
Fig. 9 Evolution of the semi-major axis of 2011 KT10 according to three different integration cases. The red line represents only the planetary perturbers (onlyplanet), the blue line shows the CVJP integration case, and the green line illustrates the integration case CVJPHIDE with many perturbers. |
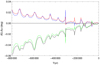 |
Fig. 10 Differences in the orbit perihelion argument and the node longitude of Mars according to two different integration cases. The two lower lines represent the perihelion argument evolution, where the green line is for the CVJP case and the black line shows the CVJPHIDE case. The two upper lines represent the node longitude evolution. The blue line shows the CVJP case, and the red line illustrates the case of CVJPHIDE. |
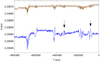 |
Fig. 11 Dynamical evolution of the semi-major axis of the pair Balam (bottom) and 2009 BR60 (top). |
7 Resonance in the case of the pair 3749 Balam and 2009 BR60
Another very interesting example of the 9:16M resonance perturbation is that of the close asteroid pair (3749) Balam and (312497) 2009 BR60 (Naoz et al. 2010). The primary asteroid of this pair is Balam, which has two satellites (Pravec et al. 2019) and a secondary asteroid 2009 BR60 (Vokrouhlický 2009). Pravec et al. (2019) estimated the age of this pair to be about 400 kyr.
The semi-major axis of Balam (2.23649 AU) is close to the values of the Datura member semi-major axes. For this reason, we can expect an effect, however weak, of the 9:16M resonance on this object. The orbit of the secondary body 2009 BR60 (a = 2.2367 AU) is more distant from this resonance, therefore its perturbations are expected to be weaker. In reality, the amplitude of the semi-major axis variations of Balam is about twice that of 2009 BR60 (Fig. 11). In particular, perturbations that took place about 75 kyr and 310 kyr ago are related to Mars orbit variations. Not all of these features can be explained by Mars resonance perturbations, however, and as yet unknown resonances might act on both the asteroids of this pair, perhaps more so on the primary, Balam. The most probable is the 11:39J resonance with Jupiterat 2.23673 AU.
Figure 11 shows that the dynamical evolution of the semi-major axis of Balam displays two peaks at approximately 310 kyr and 75 kyr ago that have a possible relation to the 9:16M resonance. These peaks are negligible in the case of the secondary body. This can easily be explained by the fact that the location of 2009 BR60 is too distant relative to the 9:16M.
8 Conclusion
Because of the widely accepted value for the age of the Datura family (450 kyr) and the sheer number of its family members, it is difficult to reconstruct a detailed dynamical history of this family. However, the Datura family provides a good case study for the interaction of a compact group of asteroids with a narrow mean motion resonance of high order (9:16). We have provided simple explanations for these interactions in some particular cases using a more accurate model of the solar system that includes not only the gravitational perturbations of the eight major planets of the solar system plus Pluto, but also the perturbations caused by the dwarf planet Ceres and the large asteroid Vesta. Additionally, we note the 9:16M perturbations in the orbit of Balam.
We have highlighted that the orbits with a very close proper semi-major axis (with a difference of about 10−5 AU) have great differences in their stability in the vicinity of high-order resonance. We further note that the distances between resonance and resonance period are more precise indicators for stability than the LCE, at least in single high-order resonance cases.
Moreover, we studied the significant role of the weaker Ceres and Vesta perturbations on the dynamics of the Datura family members and the pair Balam and 2009 BR60 close to resonance. Although we considered the Yarkovsky effect very briefly in this paper, it is evidently necessary to conduct a thorough study to come to a clear understanding of this very complex phenomenon. The simple theoretical model presented in this paper is able to account for some examples of the most recent chaotic dynamical behaviour, such as resonance jumping, which affect the relatively small main belt asteroids. It can be used as a template on which to build in future work.
References
- Baer, J., & Chesley, S. R. 2008, Celest. Mech. Dyn. Astron., 100, 27 [NASA ADS] [CrossRef] [Google Scholar]
- Carruba, V., Nesvorný, D., Marchi, S., & Aljbaae, S. 2016, MNRAS, 458, 1117 [CrossRef] [Google Scholar]
- Carruba, V., Spoto, F., Barletta, W., et al. 2020, Nat. Astron., 4, 83 [NASA ADS] [CrossRef] [Google Scholar]
- Chambers, J. E. 1999, MNRAS, 304, 793 [Google Scholar]
- Chirikov, B. V. 1979, Phys. Rep., 52, 263 [NASA ADS] [CrossRef] [Google Scholar]
- Everhart, E. 1985, in IAU Colloq. 83: Dynamics of Comets: Their Origin and Evolution, eds. A. Carusi, & G. B. Valsecchi, 115, 185 [NASA ADS] [CrossRef] [Google Scholar]
- Fatka, P., Pravec, P., & Vokrouhlický, D. 2020, Icarus, 338, 113554 [NASA ADS] [CrossRef] [Google Scholar]
- Galiazzo, M. A., Wiegert, P., & Aljbaae, S. 2016, Ap&SS, 361, 371 [NASA ADS] [CrossRef] [Google Scholar]
- Hirayama, K. 1918, AJ, 31, 185 [NASA ADS] [CrossRef] [Google Scholar]
- Jacobson, S. A., & Scheeres, D. J. 2011, Icarus, 214, 161 [NASA ADS] [CrossRef] [Google Scholar]
- Knežević, Z., & Milani, A. 2003, A&A, 403, 1165 [NASA ADS] [CrossRef] [EDP Sciences] [Google Scholar]
- Kuznetsov, E. D., Rosaev, A. E., & Plavalova, E. 2019, in 82nd Annual Meeting of The Meteoritical Society, 82, 6004 [NASA ADS] [Google Scholar]
- Laskar, J., Levrard, B., & Mustard, J. F. 2002, in AGU Fall Meeting Abstracts, 2002, P52A-0363 [Google Scholar]
- Marzari, F., Farinella, P., & Davis, D. R. 1999, Icarus, 142, 63 [NASA ADS] [CrossRef] [Google Scholar]
- Michel, P., DeMeo, F. E., & Bottke, W. F. 2015, Asteroids IV [CrossRef] [Google Scholar]
- Milani, A., Knežević, Z., Spoto, F., et al. 2017, Icarus, 288, 240 [NASA ADS] [CrossRef] [Google Scholar]
- Morbidelli, A. 2002, Modern Celestial Mechanics: Aspects of Solar System Dynamics [Google Scholar]
- Murray, C. D., & Dermott, S. F. 2000, Solar System Dynamics [CrossRef] [Google Scholar]
- Naoz, S., Perets, H. B., & Ragozzine, D. 2010, ApJ, 719, 1775 [NASA ADS] [CrossRef] [Google Scholar]
- Nesvorný, D., & Vokrouhlický, D. 2006, AJ, 132, 1950 [NASA ADS] [CrossRef] [Google Scholar]
- Nesvorný, D., Vokrouhlicky, D., & Bottke, W. F. 2006, Science, 312, 1490 [NASA ADS] [CrossRef] [Google Scholar]
- Nesvorný, D., Brož, M., & Carruba, V. 2015, Identification and Dynamical Properties of Asteroid Families, 297 [Google Scholar]
- Novaković, B., Tsirvoulis, G., Marò, S., Đošović, V., & Maurel, C. 2016, in IAU Symposium, 318, Asteroids: New Observations, New Models, eds. S. R. Chesley, A. Morbidelli, R. Jedicke, & D. Farnocchia, 46 [Google Scholar]
- Pravec, P., Fatka, P., Vokrouhlický, D., et al. 2018, Icarus, 304, 110 [NASA ADS] [CrossRef] [Google Scholar]
- Pravec, P., Fatka, P., Vokrouhlický, D., et al. 2019, Icarus, 333, 429 [NASA ADS] [CrossRef] [Google Scholar]
- Rosaev, A., & Plávalová, E. 2017, Planet. Space Sci., 140, 21 [NASA ADS] [CrossRef] [Google Scholar]
- Rosaev, A., & Plávalová, E. 2018, Icarus, 304, 135 [Google Scholar]
- Skokos, C. 2010, The Lyapunov Characteristic Exponents and Their Computation, ed. J. Souchay, & R. Dvorak 790, 63 [NASA ADS] [Google Scholar]
- Spoto, F., Milani, A., & Knežević, Z. 2015, Icarus, 257, 275 [NASA ADS] [CrossRef] [Google Scholar]
- Subbotin, M. F. 1968, Introduction to Theoretical Astronomy [Google Scholar]
- Tholen, D. J. 1984, PhD Thesis, University of Arizona, Tucson [Google Scholar]
- Vokrouhlický, D. 2009, ApJ, 706, L37 [NASA ADS] [CrossRef] [Google Scholar]
- Vokrouhlický, D., Nesvorný, D., & Bottke, W. F. 2008, ApJ, 672, 696 [NASA ADS] [CrossRef] [Google Scholar]
- Vokrouhlický, D., Durech, J., Michałowski, T., et al. 2009, A&A, 507, 495 [NASA ADS] [CrossRef] [EDP Sciences] [Google Scholar]
- Vokrouhlický, D., Pravec, P., Durech, J., et al. 2017, A&A, 598, A91 [NASA ADS] [CrossRef] [EDP Sciences] [Google Scholar]
- Vokrouhlický, D., Novaković, B., & Nesvorný, D. 2021, A&A 649, A115 [Google Scholar]
- Yoder, C. F. 1979, Celest. Mech., 19, 3 [NASA ADS] [CrossRef] [Google Scholar]
For further details, see https://newton.spacedys.com/astdys/ and references herein. We built the dependence of the LCE on the proper semi-major axis (Fig. 2).
All Tables
Osculating orbital elements of the Datura family members at epoch 2 451 000.5 = AD 1998-Jul-06 00:00.
Uncertainties of orbital elements of the Datura family members (1σ interval) from the JPL Small-Body Database Browser.
9:16M resonance positions and widths related to the node rate variations of Mars.
All Figures
|
Fig. 1 Evolution of the orbit of (89309) 2001 VN36 depending on the initial variations in orbital elements. The dynamical evolutions of the orbit as a function of the eccentricity and inclination are shown in the upper graph, and the node and perihelion longitude variations are shown in the lower graph. |
| In the text | |
|
Fig. 2 Lyapunov characteristic exponent (LCE) for the members of the Datura family. The analytic semi-major axis dependence is shown as red dots, and the synthetic semi-major axis dependence is shown as blue squares. |
| In the text | |
|
Fig. 3 Evolution of the semi-major axis of 2014 OE206 close to 50 kyr ago. |
| In the text | |
|
Fig. 4 Dynamical evolution of the semi-major axis of Datura family members, illustrating jumps close to 50 and 310 kyr ago. |
| In the text | |
|
Fig. 5 Evolution of the node longitude (red line) and inclination (blue line) of the Mars orbit close to 60 kyr ago. |
| In the text | |
|
Fig. 6 Evolution of the Mars orbit eccentricity using our results (red line) compared with the integration (blue line) by Laskar et al. (2002). |
| In the text | |
|
Fig. 7 9:16M resonant argument for a representative clone of (485010) 2009 VS116. |
| In the text | |
|
Fig. 8 Evolution of the semi-major axis of 2001 VN36 in two different integration cases. The upper green line represents only the planetary perturbers (onlyplanet), and the lower red line additionally shows the perturbers Ceres, Vesta, Juno, and Pallas (the CVJP integration case). |
| In the text | |
|
Fig. 9 Evolution of the semi-major axis of 2011 KT10 according to three different integration cases. The red line represents only the planetary perturbers (onlyplanet), the blue line shows the CVJP integration case, and the green line illustrates the integration case CVJPHIDE with many perturbers. |
| In the text | |
|
Fig. 10 Differences in the orbit perihelion argument and the node longitude of Mars according to two different integration cases. The two lower lines represent the perihelion argument evolution, where the green line is for the CVJP case and the black line shows the CVJPHIDE case. The two upper lines represent the node longitude evolution. The blue line shows the CVJP case, and the red line illustrates the case of CVJPHIDE. |
| In the text | |
|
Fig. 11 Dynamical evolution of the semi-major axis of the pair Balam (bottom) and 2009 BR60 (top). |
| In the text | |
Current usage metrics show cumulative count of Article Views (full-text article views including HTML views, PDF and ePub downloads, according to the available data) and Abstracts Views on Vision4Press platform.
Data correspond to usage on the plateform after 2015. The current usage metrics is available 48-96 hours after online publication and is updated daily on week days.
Initial download of the metrics may take a while.