Free Access
Fig. 9
Download original image
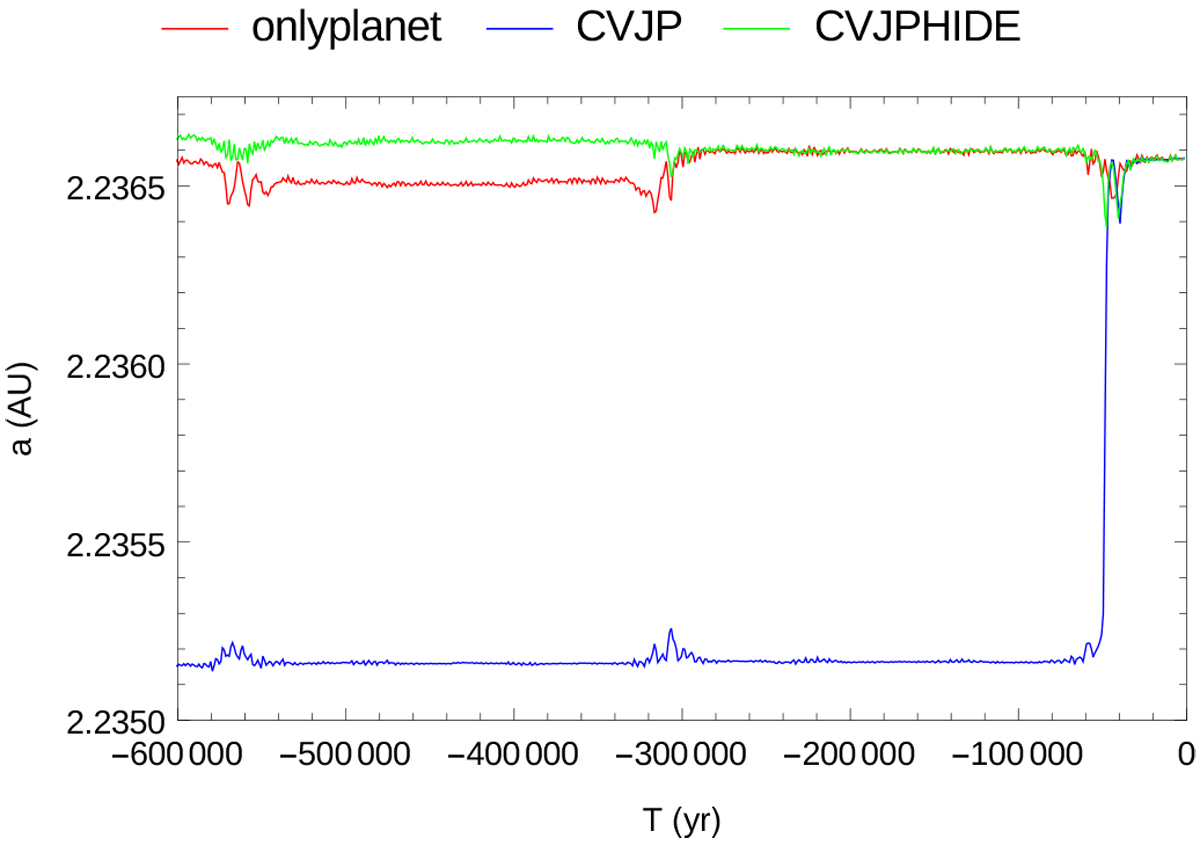
Evolution of the semi-major axis of 2011 KT10 according to three different integration cases. The red line represents only the planetary perturbers (onlyplanet), the blue line shows the CVJP integration case, and the green line illustrates the integration case CVJPHIDE with many perturbers.
Current usage metrics show cumulative count of Article Views (full-text article views including HTML views, PDF and ePub downloads, according to the available data) and Abstracts Views on Vision4Press platform.
Data correspond to usage on the plateform after 2015. The current usage metrics is available 48-96 hours after online publication and is updated daily on week days.
Initial download of the metrics may take a while.