| Issue |
A&A
Volume 653, September 2021
|
|
|---|---|---|
| Article Number | A45 | |
| Number of page(s) | 13 | |
| Section | Interstellar and circumstellar matter | |
| DOI | https://doi.org/10.1051/0004-6361/201937012 | |
| Published online | 07 September 2021 | |
Singly and doubly deuterated formaldehyde in massive star-forming regions
1
Department of Physical Science, Graduate School of Science, Osaka Prefecture University,
1-1 Gakuen-cho, Naka-ku,
Sakai,
Osaka
599-8531,
Japan
e-mail: s.zahorecz@p.s.osakafu-u.ac.jp
2
Chile Observatory, National Astronomical Observatory of Japan, National Institutes of Natural Science,
2-21-1 Osawa,
Mitaka,
Tokyo
181-8588,
Japan
3
Centro de Astrobiología (CSIC/INTA),
Ctra de Torrejón a Ajalvir, km 4,
E-28850
Torrejón de Ardoz,
Spain
4
European Southern Observatory,
Karl-Schwarzschild-Str. 2,
85748,
Garching bei München,
Germany
5
Joint Institute for VLBI ERIC (JIVE),
Postbus 2,
7990
AA Dwingeloo,
The Netherlands
6
INAF-Osservatorio Astrofisico di Arcetri,
L.go E. Fermi 5,
50125
Firenze,
Italy
7
Max-Planck-Institut für Extraterrestrische Physik,
Giessenbachstrasse 1,
85748
Garching bei München,
Germany
8
Kavli Institute for Astronomy and Astrophysics, Peking University,
5 Yiheyuan Road,
Haidian District,
Beijing
100871,
PR China
Received:
29
October
2019
Accepted:
8
June
2021
Context. Deuterated molecules are good tracers of the evolutionary stage of star-forming cores. During the star formation process, deuterated molecules are expected to be enhanced in cold, dense pre-stellar cores and to deplete after protostellar birth.
Aims. In this paper, we study the deuteration fraction of formaldehyde in high-mass star-forming cores at different evolutionary stages to investigate whether the deuteration fraction of formaldehyde can be used as an evolutionary tracer.
Methods. Using the APEX SEPIA Band 5 receiver, we extended our pilot study of the J = 3 →2 rotational lines of HDCO and D2CO to eleven high-mass star-forming regions that host objects at different evolutionary stages. High-resolution follow-up observations of eight objects in ALMA Band 6 were performed to reveal the size of the H2CO emission and to give an estimate of the deuteration fractions HDCO/H2CO and D2CO/HDCO at scales of ~6″ (0.04–0.15 pc at the distance of our targets).
Results. Our observations show that singly and doubly deuterated H2CO are detected towards high-mass protostellar objects (HMPOs) and ultracompact H II regions (UC H II regions), and the deuteration fraction of H2CO is also found to decrease by an order of magnitude from the earlier HMPO phases to the latest evolutionary stage (UC H II), from ~0.13 to ~0.01. We have not detected HDCO and D2CO emission from the youngest sources (i.e. high-mass starless cores or HMSCs).
Conclusions. Our extended study supports the results of the previous pilot study: the deuteration fraction of formaldehyde decreases with the evolutionary stage, but higher sensitivity observations are needed to provide more stringent constraints on the D/H ratio during the HMSC phase. The calculated upper limits for the HMSC sources are high, so the trend between HMSC and HMPO phases cannot be constrained.
Key words: ISM: molecules / astrochemistry / stars: formation
© ESO 2021
1 Introduction
Deuterium fractionation, and how it changes as star-formation proceeds, is a powerful tool to establish the evolutionary stage and age of star-forming cores. The formation of deuterated molecules is favoured at low temperatures (T ≤ 20 K) and at high densities (n ≥ 104 cm−3) in molecular cloud cores at the ideal conditions for CO freeze out (Caselli et al. 1999, 2002). However, deuterated molecules are also observed with relatively high abundances in warmer environments, for example, in circumstellar disks and in hot cores (e.g. Salinas et al. 2017; Sakai et al. 2018). Different chemical processes contribute to the deuteration enrichment at different temperatures. At low (T=10–20 K) temperatures, the dominant gas-phase process is H +HD ⇌H2D++H2. At high temperatures (T=30–50 K), however, the CH
 +HD ⇌CH2D++H2 and C2H
 +HD ⇌C2HD++H2 reactions become important (see detailed gas-phase deuteration models by e.g. Roueff et al. 2007; Roueff & Lique 2013). Reactions on the grain surfaces can also influence the D/H ratio via low-temperature surface reactions during the pre-stellar and starless phase that enrich the D/H ratio of molecules in the solid phase. These molecules can then be desorbed into the gas phase during the warm protostellar phase (e.g. Brown & Millar 1989a,b; Tielens 1983).
We can characterise the deuteration fraction, Dfrac, as the relative abundance between a species containing a deuterium atom as compared to the same species containing a hydrogen atom. It is thus expected that Dfrac is enhanced in cold and dense pre-stellar cores, and it should then decrease after protostellar birth, when the young stellar object heats up the central region of the core (Caselli 2002). Several studies (see e.g. Crapsi et al. 2005; Caselli et al. 2008; Emprechtinger et al. 2009) have confirmed this theoretical scenario for low-mass star-forming cores, with the observations of deuterated species produced by gas-phase reactions (e.g. H2 D+ and N2 D+). Recent studies have shown that high Dfrac values are also typical for high-mass star-forming cores and that the Dfrac of some species could also be an evolutionary tracer in the intermediate- and high-mass regime (e.g. Busquet et al. 2010; Fontani et al. 2011, 2015; Sakai et al. 2012; Zahorecz et al. 2017).
Recent theoretical studies (e.g. Bovino et al. 2017; Körtgen et al. 2018; Hsu et al. 2021) have shown that the evolution of the deuterium enrichment depends on several factors, such as the initial physical conditions, grain size distribution, the depletion fraction, and the cosmic ray ionisation rate. Observational studies (e.g. Crapsi et al. 2005; Emprechtinger et al. 2009; Fontani et al. 2011, 2015; Treviño-Morales et al. 2014) have confirmed that the deuterium chemistry is a good chemical clock for both low-mass and high-mass star-forming cores. However, in order to have an accurate estimate of the evolutionarystage of the source, it is necessary to use as many different molecular tracers as possible since the derived Dfrac may differ due tovariations in the chemical evolution of the different species (see e.g. Treviño-Morales et al. 2014).
We can distinguish the following evolutionary stages in high-mass star-forming regions: high-mass starless cores (HMSCs), high-mass protostellar objects (HMPOs), and ultracompact H II regions (UC H II regions) (e.g. Beuther et al. 2007; Tan et al. 2014). Gerner et al. (2014) derived the chemical age of ~ 6 × 10⁴, ~ 4 × 10⁴, and ~ 104 yr for the HMSC, HMPO, and UC H II stage, respectively. Their derived total timescale for the high-mass star-formation is consistent with theoretical estimates of ~ 105 yr. Based on the study of several deuterated species in 27 massive cores in different evolutionary stages from HMSCs to UC H II regions, Fontani et al. (2011, 2015) found that species formed exclusively in the gas (N2 H+) that showed different evolutionary trends from those that formed partially (NH3) or totally (CH3OH) on grain mantles. The Dfrac(N2H+) is higher in the HMSC phase and it drops by about an order of magnitude during the HMPO and UC H II stages, while deuterated methanol is detected only towards HMPOs and externally heated HMSCs. Therefore, high Dfrac(N2H+) is a good indicator of the initial conditions in starless and pre-stellar cores, while high Dfrac(CH3OH) values are a good probe of the earliest protostellar phases (Fontani et al. 2015). Furthermore, Dfrac(NH3) does not show a significant difference across the different evolutionary stages, and thus, there are no dominant formation pathways (gas-phase versus grains) for NH3 and its deuterated forms.
As NH3, formaldehyde (H2CO) can also be produced both in the gas phase and on grain surfaces. The two main pathways for the production of H2CO involve CH in the gas phase (see Yamamoto 2017) and multiple hydrogenation of CO on the ices (see e.g. Roberts & Millar 2007). Its gas phase pathway is similar to the one of N2 H+, but it can also occur at warmer temperatures (30–50 K, see Parise et al. 2009). The ice phase formation route of H2CO is similar to that of CH3OH and their deuterated forms. Laboratory work and observational studies of low-mass protostars suggest an important contribution from grain surface chemistry to the production of H2CO (Watanabe 2005; Roberts & Millar 2007; Bergman et al. 2011). However the relative importance of the grain surface versus gas-phase formation routes remains unclear. Furthermore, only a handful D2CO detections in high-mass star-formingregions are available (D2CO has been firmly detected towards the Orion Compact Ridge, NGC 7129-FIRS 2, AFGL5142, IRAS05358+3543, and tentatively towards the MonR2 UC H II region; Fuente et al. 2005; Treviño-Morales et al. 2014; Turner 1990; Zahorecz et al. 2017).
All of these initial results suggest that H2CO and its deuterated species form mostly on grain surfaces. However, more observations carried out with interferometers (i.e. at high-angular resolution) are needed to separate the HDCO and D2CO emission originating from the small and dense cores and to get a more detailed view of the formaldehyde deuteration in high-mass star-formingregions.
In this paper, we report our findings of a search for HDCO and D2CO emission towards an extended sample of high-mass star-forming regions at different evolutionary stages, using the Atacama Pathfinder EXperiment (APEX1) and the Atacama Large Millimeter/submillimeter Array (ALMA) telescopes. The source sample and the observations are described in Sect. 2, while our results are presented in Sect. 3. In Sect. 4, we discuss our results and put them in context with respect to previous findings in low-mass and high-mass star-forming regions. In Sect. 5, we summarise our conclusions.
2 Observations and target selection
In this section, we describe our selected sources and the single-dish and interferometric observations we have carried out for our study.
2.1 Selected targets
The selected sources are extracted from the sample of Fontani et al. (2011), for which the deuteration fraction of other molecules (e.g. N2 H+, CH3OH, and NH3) has been measured (Fontani et al. 2015). We selected the brightest sources from each evolutionary class, which are observable with the APEX telescope from the southern hemisphere. Table 1 reports the observed central coordinates, velocities, distances, kinetic temperatures, and source evolutionary classification for our targets. The sample is divided into three HMSCs, three HMPOs, two sources containing HMSC and HMPO, which would represent an intermediate stage between HMSC and HMPO, and three UC H II regions (see details below). The source coordinates have been centred at interferometric millimeter and centimeter continuum peaks or high-density gas tracer peaks (e.g. NH3 with VLA) that are separated by at least ~ 10′′ from other cores. The APEX beam is ~34″ at 190 GHz. Therefore, for AFGL5142 and IRAS05358+3543, multiple cores at different evolutionary stages are covered within the same pointing. We categorise these two sources as a transitional stage between HMSCs and HMPOs in our work.
2.2 IRAM-30m H2CO observations
Previous observations of these objects were performed using the IRAM-30m telescope (details can be found in Fontani et al. 2011, 2015). The frequency setups included the 30,3 − 20,2, 32,2 − 22,1, and 32,1 − 22,0 transitions of H2CO. The spectroscopic information of these transitions is shown in Table 2 (Müller et al. 2005). The spectra were obtained and calibrated in antenna temperature units,  , and then converted to the main beam brightness temperature, TMB, with the following equation:
  , where a main beam efficiency, ηMB, of 0.66 was used. The H2CO line emission was detected in all sources and the measured intensities show a wide range between 0.24 K < TMB < 13 K (see Fig. 1).
2.3 APEX SEPIA observations
The sources were observed with the APEX SEPIA receiver (Swedish-ESO PI receiver for APEX; Billade et al. 2012; Belitsky et al. 2018), as part of the ESO E-095.F-9808A, E-096.C-0484A, and E097.C-0897A projects between July 2015 and June 2016. The first results based on the science verification dataset for AFGL5142, IRAS05358+3543, and G5.89-0.39 are presented in Zahorecz et al. (2017). We carried out single-pointing observations of HDCO and D2CO emission using the position switching observing mode. The J2000 central coordinates used in our observations are shown in Table 1. The observed transitions of HDCO (at 185 GHz and 193 GHz) and D2CO (at 174.4 GHz) are shown in Table 2. The pointing was checked every 60–90 min, and the typical system temperatures were 150 K. The beam size at 183 GHz was ~ 34′′. The spectra were obtained and calibrated in antenna temperature units and then converted to the main beam brightness temperature using ηMB of 0.68. The XFFTS spectrometer provided a velocity resolution of 0.112 km s−1, 0.059 km s−1, and 0.066 km s−1 for the H CO (at 206 GHz), HDCO (at 185–193 GHz), and D2CO (at 174 GHz) transitions, respectively. However, for the data analysis, we smoothed the spectra to a uniform velocity resolution of 0.5 km s−1. At this velocity resolution, we reached an rms of ~0.01 K with typical integration times between 32 and 48 min. The PWV was 0.3–1.5 mm. The data were reduced and analysed with the Gildas software2 (Pety 2005).
Observed sources and their coordinates, LSR velocities, distances, kinetic temperatures, and 12C/13C ratio at the corresponding distance.
2.4 ALMA Cycle 5 observations
We performed high-resolution single pointing observations with ALMA in Cycle 5 as part of the 2017.1.01157.S project (PI: S. Zahorecz). We used the Atacama Compact Array (ACA, Morita Array; Iguchi et al. 2009). Band 6 observations were executed for G028-C1, G34-F2, G34-G2, 18089-1732, 18517+0437, G5.89-0.39, I1935-VLA1, and 1941+2336. We used two setups to observe selected molecular lines, including H CO, and to observe the continuum emission. Table 2 contains the basic information of the observed H
 CO transition. In this paper, we use the continuum and H
 CO emission information at 213 GHz to derive the source sizes. A detailed analysis of all the detected lines will be presented in a following paper. A continuum sensitivity of at least ~ 20 mJy beam−1 was achieved for the targets. For the three HMSC cores, a higher sensitivity of ~ 3 mJy beam−1 was achieved. For the molecular line observations, a sensitivity of 0.1 Jy beam−1 was achieved at a velocity resolution of 0.086 km s−1.
3 Results
In this section, we present the line and continuum emission detected towards our targets. We use the ALMA Band 6 data to estimate thesource sizes. Our calculations of the excitation temperature and column density of formaldehyde and its deuterated species are based on the single-dish APEX and IRAM spectra. We also present the column density ratios of the detected molecules.
3.1 Line spectra of deuterated H2CO species
In Fig. 1, we present the H2CO, HDCO, and D2CO 30,3 − 20,2 lines and the H CO 31,2 − 21,1 line towards our sources observed with the IRAM-30m and APEX telescopes. Six sources show multi-velocity components; we performed the calculations separately for them. Neither HDCO nor D2CO emission were detected towards the HMSC sources. The HDCO lines (upper energy levels of 18.5–50.4 K) are clearly detected in seven sources (all sources except the HMSC sources and I19035-VLA1). The D2CO 30,3 − 20,2 transition is only detected clearly towards four sources: the two HMSC/HMPO sources (AFGL5142 and IRAS05358+3543), one HMPO object (18517+0437), and one UC H II region (19410+2336). We tentatively detected the same line towards one more HMPO object, G75-core, and one more UC H II region, I19035-VLA1, but further observations are needed to confirm these detections. We used only the clear detections in our calculations and considered the rest as upper limits.
We checked the H CO 30,3 − 20,2 and continuum emission of our sources in our Band 6 ALMA data. The continuum emission was detected for six objects out of the eight sources covered in our observations. We observed, but did not detect, compact continuum sources above 3σ towards two sources in the youngest, HMSC evolutionary stage (G034-F2 and G034-G2) at our sensitivity and resolution. We note that Kong et al. (2017) observed these objects and detected 1.3 mm continuum emission of ~ 1–3 mJy beam−1 with a beam size of 1.5″ × 1.0″. The H
 CO emission was not detected towards any of the HMSC sources. For the objects with detection, the H
 CO emission is associated with the same region as the continuum emission. Figure 2 shows the continuum maps at 213 GHz and the H
 CO contours overplotted. We derived the effective radius of the sources based on the 2D Gaussians fitted to the continuum maps. The derived source sizes are between 3″ and 5.8″. We note that in Zahorecz et al. (2017), we used 6″ as the source size for AFGL5142, IRAS05358+3543, and G5.89-0.39. In our actual calculations, we updated the size of G5.89-0.39 based on its ALMA continuum emission. AFGL5142 and IRAS05358+3543 have no ALMA data and G028-C1, G034-F2, and G034-G2 have no H
 CO detection and/or continuum detection. We kept the assumption of a 6″ source size for these five objects in our calculations.
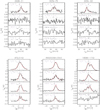 |
Fig. 1 Spectra of the H2CO 30,3 − 20,2 and H |

Targeted transitions and beam sizes, beam coupling efficiencies, and spectral resolution of our IRAM 30 m, APEX SEPIA, and ALMA Band 6 observations.
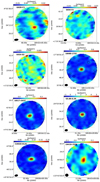 |
Fig. 2 213 GHz continuum maps towards G028-C1, G034-F2, G034-G2, 18089-1732, 18517+0437, G5.89-0.39, I19035-VLA1, and 19410+2336 (sorted by evolutionary stage). The black contours indicate the 3, 5, 10, and 15 σ levels of H |


3.2 Molecular column densities and column density ratios
To estimate the molecular column densities from the APEX and IRAM spectra of H2CO, H CO, HDCO, and D2CO, we used the MADCUBA software that assumes LTE conditions (Martín et al. 2019). We used the Spectral Line Identification and Modelling (SLIM) tool to produce synthetic spectra of the observed molecules. When generating the synthetic spectra, the beam size was taken into account by the software to return the appropriate line intensities. The MADCUBA-AUTOFIT tool was used to derive the physical conditions of the gas by comparing the observed spectra with the LTE synthetic spectra taking all transitions considered into account. The autofit tool uses the Levenberg–Marquardt algorithm to provide the best non-linear least-squared fit (see details in Martín et al. 2019). We adopted a source size of 3.′′0 – 6.′′0 according to the continuum sizes measured with ALMA and following Zahorecz et al. (2017) and Fontani et al. (2015) for sources without continuum detection. We derived the excitation temperature of the gas, Tex, using the four APEX HDCO transitions (Table 2). The derived average temperature is ~ 32 K, with a standard deviation of 17 K. We used these temperatures to fit the H
 CO, HDCO, and D2CO transitions. For the brightest sources, we could not fit all the detected H2CO transitions using these low Tex temperatures. In this case, we used the H2CO lines independently to derive their excitation temperature. For the youngest sources, the HMSCs, no HDCO emission was detected; therefore, we derived the excitation temperature based on the H2CO lines. We used the 3σ noise levels to provide the upper limits to the intensity of the non-detected lines.
We estimated the H2CO column densities from the H CO column density using the 12C/13C ratio (see in Table 1) derived by Milam et al. (2005) as a function of the Galactocentric distance to minimise the optical depth’s effect. In Table A.1, we report the derived excitation temperatures and column densities of H2CO, H
 CO, HDCO, and D2CO.
In Table 3, we report the calculated column density ratios of HDCO/H2CO, D2CO/H2CO, and D2CO/HDCO. The column density ratio HDCO/H2CO corresponds to the Dfrac(H2CO) value. The presented column density ratios are source-averaged values. We note that the different source distance can, in principle, introduce biases in the comparison because the linear scale observed is not the same. However, in our study we see from the interferometric images that the emission of the lines is more compact than the beam, and hence the emission arising from the (different) envelope region should not influence the derived source-averaged ratios in a significant way. The D2CO/HDCO column density ratios show no clear trend since they have a large scatter around the median value of 0.21 (standard deviation of 2.16). The N(HDCO)/N(H2CO) and N(D2CO)/N(H2CO) ratios show a similar trend. The deuteration fraction of singly deuterated formaldehyde shows higher values, around 0.1 at the HMSC-HMPO stage and it decreases to 0.01 at the UC H II phase. The deuteration fraction of the doubly deuterated formaldehyde reaches 0.03 at the earliest stages and drops down to 0.003 at the most evolved phase.
Calculated column density ratios for the observed species.
4 Discussion
In this section we compare our results with those inferred from previous observational studies (Sect. 4.1). We also put our results in context with theoretical studies of formaldehyde deuteration via grain-surface and gas-phase processes (Sect. 4.2).
4.1 Comparison with previous observational studies
Fontani et al. (2011) presented the kinetic temperatures based on ammonia data. Nine sources from our sample have available ammonia temperatures with values lying between ~20–40 K, except for the G75-core, which has a higher kinetic temperature of 96 K. The HDCO-based temperature estimates are in good agreement with the ammonia temperatures for most of the sources: they are in the 15–40 K range. G5.89-0.39 and I19035-VLA1 show higher HDCO excitation temperatures, that is ~60–70 K. For the youngest HMSC sources, we only detected H2CO. The excitation temperatures fall into the 20-30 K range. For some of the sources, the HDCO derived temperatures were too low to fit the line intensity ratios of the observed H2CO transitions. Also in these cases, we derived the H2CO excitation temperature, finding values a factor of 2–3 higher than the HDCO values in the range of ~70–130 K.
Fontani et al. (2015) have proposed that in high-mass star-forming regions, the different trend for the deuteration pattern of different molecules, such as N2H+, HNC, NH3, and CH3OH as a function of the evolutionary stage, is likely due to the way deuteration occurs for the different species: for N2 H+, deuteration occurs in the gas phase, while for CH3OH it occurs on grain surfaces; and for NH3, deuteration likely occurs via a mixture of these two processes. In the following, we discuss the likelihood of each of these two chemical routes to drive the formation of the deuterated forms of H2CO during the massive star formation process.
4.2 Grain-surface deuteration of H2CO
Traditionally, it has been assumed that the deuterated forms of H2CO are a product of grain-surface chemistry. Indeed, Taquet et al. (2012) showed that the gas-phase formation timescales of D2CO are longer than the depletion timescales in the pre-stellar phase and, therefore, one would expect D2CO to be a product of material processed on solid ices. Consequently, the N(D2CO)/N(H2CO) ratio should show an evolutionary trend similar to that derived for Dfrac(CH3OH), which peaks at the HMPO phase (Fontani et al. 2015). If HDCO showed a similar behaviour as D2CO, we could conclude that HDCO also forms mostly on dust grains. This hypothesis would be supported by the fact that HDCO is detected in hot cores and hot corinos while N2 D+ is not (see e.g. Fuente et al. 2005).
Figure 3 shows that the column density ratios of N(HDCO)/N(H2CO) and N(D2CO)/N(H2CO) decrease from the HMSC-HMPO phase to the UC H II phase by factors of ≥ 10. We note that for the two sources in the HMSC/HMPO transitional category (AFGL5142 and IRAS05358+3543), we cannot disentangle the contribution of the HMSC cores from the HMPO ones. However, from our observations it is clear that they show higher column density ratios than those found for the UC H II regions, confirming the decrease of the N(HDCO)/N(H2CO) and N(D2CO)/N(H2CO) trend. Based on the available upper limits for the HMSC cores, we cannot exclude the possibility that the D2CO/H2CO column density ratio peaks in the early phases. However, the upper limits obtained for the HMSC cores suggest lower column density ratios than those of the HMPO objects, or at most equal HDCO/H2CO column density ratios. This behaviour is similar to the trend observed for Dfrac(CH3OH), but with a larger scatter. This suggests that grain surface chemistry may be the main formation mechanism for HDCO and D2CO.
Rodgers & Charnley (2002) proposed a grain surface formation scenario for these molecules in which H2CO and its deuterated forms represent intermediate steps in the formation of CH3OH and deuterated-CH3OH via hydrogenation and D-addition reactions. They defined the F parameter (see Eq. (1)) to investigate the extent by which surface chemistry is responsible for the production of HDCO and D2CO. Rodgers & Charnley (2002) found that gas-phase chemistry should produces F values between 1.6 and 2.3, and grain surface chemistry should result in F values ≥1. Previous observations, however, have reported F values lower than 1, which are not consistent with the cases presented above. Alternatively, low F values could be obtained through a grain surface chemistry over a long time period (Rodgers & Charnley 2002), because longer timescales allow the conversion of HDCO into D2CO on the surface of dust grains. We derived the F parameter based on our calculated HDCO/H2CO and D2CO/H2CO ratios using the definition of Rodgers & Charnley (2002):
![\begin{equation*}F=\frac{[\mathrm{HDCO}/\mathrm{H}_2\mathrm{CO}]^2}{[\mathrm{D}_2\mathrm{CO}/{\textrm{H}_2\textrm{CO}}]}.\end{equation*}](/articles/aa/full_html/2021/09/aa37012-19/aa37012-19-eq21.png) (1)
(1)
In our sample sources with D2CO detections, F lies between 0.1 and 1.1 (except 18517+0437, where the two fitted components show F values ~3 and ~0.001). For the sources with only upper limits for the detection of D2CO, the lower limits for the F values are within 0.1 and 0.6. These values cannot be explained by gas phase chemistry, but they are more consistent with grain surface chemistry models.
Table 3 also shows that the D2CO/HDCO ratio remains constant at ~0.2, within the uncertainties, regardless of the source or evolutionary stage (except for 18517+0437). As for the low-mass regime, the ratio HDCO/D2CO lies well below the statistical value given as D-species/D2-species = 4 × (D-species/H-species)−1, which is consistent with the grain surface formation scenario (see Ceccarelli et al. 2014).
Ceccarelli et al. (2014) calculated the column density ratios for HDCO/H2CO and D2CO/H2CO for a sample of low-mass star-forming cores (see their Fig. 5). The derived ratios lie close to 1 for those objects. The average derived  ratio is ~5.3 with a standard deviation of 3.4 for our high-mass star-forming regions, and 1.1 if we exclude the two velocity components of the 18517+0437 region, showing a large difference from the other sources. If we compare these findings with the results of Ceccarelli et al. (2014), it is possible that the higher values measured towards our sample are the result of the shorter timescales available in the high-mass regime for the formation of D2CO in the ices (Taquet et al. 2012; Rodgers & Charnley 2002). In fact, the HDCO/H2CO ratios are factors ~10 or more larger than Dfrac(CH3OH) in high-mass star-forming regions, which is also consistent with the shorter timescales available for deuteration in high-mass star formation with respect to the low-mass case, and with the formation of these species via hydrogenation and D-addition reactions on grain surfaces (Turner 1990; Rodgers & Charnley 2002).
Turner (1990) reported the first interstellar detection of a multiply deuterated molecule, D2CO, in the Orion KL ridge component with a D2CO/H2CO column density ratio of 0.021. The calculated HDCO/H2CO column density ratio was 0.14. These ratios could not be reproduced by ion-molecule gas phase reactions, but they can be fitted by the model of grain surface reactions of Tielens (1983). Additional studies towards dark clouds TMC-1 and L183 were performed by Turner (2001) and they reported HDCO/H2CO column density ratios of 0.059 and 0.068, respectively.
In addition, Fontani et al. (2014) successfully detected HDCO towards the protostellar bow-shock L1157-B1 where material from icy mantles is thought to be freshly released due to mantle evaporation. They have found a column density ratio of HDCO/H2CO value of 0.1, which is similar to the values found in our study. Bianchi et al. (2017) studied the deuteration in Sun-like protostars. Their Fig. 9 shows measured column density ratios of HDCO/H2CO as a function of the bolometric luminosity for both low-mass and high-mass star-forming regions from the protostellar phase to the Class I phase. They have also found that the average column density ratio measured in Class 0 sources for HDCO is ~0.12. However, D2CO shows an increase going from pre-stellar cores, with an average value of N(D2CO/H2CO) ~ 0.045, to Class 0 sources (~0.15) and then a strong decrease in the Class I protostar phase (see the case of SVS13-A; Bianchi et al. 2017). Our results indicate a similar, but not identical, evolutionary behaviour since no clear detection of deuterated formaldehyde is available for the HMSC sources.
As part of the ALMA-PILS survey, Persson et al. (2018) and Manigand et al. (2020) have reported the deuterium fraction of formaldehyde for IRAS 16293-2422 A and B. Their relative evolutionary stages are under debate, although recent studies suggest that the B component is at an early evolutionary stage (van der Wiel et al. 2019). Formaldehyde abundance is lower towards the A component with a HDCO/H2CO column density ratio of around 0.049 and 0.065 for the A and B components, respectively. They agree well with our results for the HMPO sources. Persson et al. (2018) and Manigand et al. (2020) have also found that the doubly deuterated isotopologue D2CO is significantly enhanced compared to the singly deuterated isotopologue towards the B component. The calculated D2CO/H2CO column density ratios are 0.041 and 0.006, which are similar to the values obtained for our HMPO sources. For the B source, the column density ratio of D2CO/HDCO is slightly larger than the column density ratio HDCO/H2CO, which is consistent with formaldehyde forming in the ice as soon as CO is frozen onto grains. Figure 4 shows the comparison of the observed H2CO, HDCO, and D2CO column density ratios in different environments based on the works mentioned in this section.
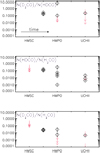 |
Fig. 3 Comparison of observed column density ratios of H2CO, HDCO, and D2CO. Upper limits are shown with red symbols. The arrow in the top panel indicates the increasing time from the HMSC phase towards the UC H II phase. |
4.3 Gas-phase deuteration of H2CO
Alternatively to the grain-surface formation of HDCO and D2CO, the deuterated forms of H2CO could be produced by gas-phase chemistry. Roberts & Millar (2007) and Roueff et al. (2007) proposed that deuterium fractionation of H2CO may occur via the fractionation of CH (CH2D+ → CH4D+ → CH2D → HDCO) or of H2CO directly via the reaction with H2 D+. In particular, in the gas-phase steady-state models of Bergman et al. (2011) based on the reaction network of Roueff et al. (2007), these authors also predict a decrease in the deuteration of H2CO from the HMSC/HMPO stage to the UC H II region phase as the temperature exceeds 40 K. The predicted values for the D/H ratio inferred from the HDCO/H2CO and D2CO/HDCO ratios are indeed consistent with our observations (see their Fig. 12). Indeed, while the HDCO/H2CO ratio gives ~0.1 for T ~ 10–30 K and ≤0.04 for T ≥ 40 K, the D2CO/H2CO ratio remains relatively flat at ~0.2 for T ~ 10–40 K, as observed in our sample. The only difference between our observations and the predictions by Bergman et al. (2011) is that, while in our observations the HDCO/H2CO ratio drops by more than one order of magnitude from the HMPO to the UC H II region stage, the chemical modelling predicts a smaller drop by only factors from 3–4. Parise et al. (2009) found high deuterium fractionation towards the Orion Bar PDR region. The calculated deuterium fractions are consistent with predictions of pure gas-phase chemistry models at warm temperatures. They have found an N(HDCO)/N(H2CO) ratio of 0.0057. This value is in the range found for the UC H II regions in our sample.
In any case, to distinguish between the grain-surface from the gas-phase scenarios, we would need to obtain stringent upper limits to the HDCO/H2CO ratios at the HMSC stage. From our observations, these limits can get as low as ≤ 0.1 when considering the rms measured over the whole linewidth of the lines, which is still consistent with the gas-phase results from the models of Bergman et al. (2011) (grain-surface deuteration is expected to give much lower upper limits as a consequence of freeze-out in the cold conditions of HMSC). Therefore, although our results suggest that grain surface deuteration is the most likely mechanism for the formation of HDCO and D2CO in star-forming regions, higher sensitivity observations are needed to provide more stringent constraints to the column density ratio of HDCO/D2CO during the HMSC phase.
5 Summary
We have observed 213 GHz continuum, H CO, HDCO, and D2CO emission with APEX and ALMA towards a sample of high-mass star-forming regions at different evolutionary stages. HDCO transitions were detected for all of them except the three youngest sources in the HMSC stage, while the D2CO line was detected only for four sources from the HMSC-HMPO stage to the UC H II stage. The H
 CO emitting regions are similar to the continuum source sizes; they are in the range of 3″–5.8″ corresponding to 0.02–0.07 pc at the distance of the investigated regions. The column density ratio of HDCO/H2CO shows the highest values of ~0.13 in the earlier evolutionary stages (HMSC-HMPO) and then decreases by an order of magnitude towards the UC H II phase to ~ 0.01. This study confirms the idea that H2CO, and its deuterated species, form mostly on grain surfaces although some gas-phase contribution is expected at the warm HMPO stage. The calculated upper limits for the HMSC sources are high, around 0.5, so we cannot constrain the trend between HMSC and HMPO phases. More sensitive follow-up observations are needed for the HMSC sources to better constrain the upper limits. The observed column density ratios are in good agreement with the values previously reported in the literature for low-mass prestellar cores, protostellar objects, and PDR regions.
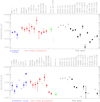 |
Fig. 4 Comparison of the observed N(D2CO)/N(H2CO) (top panel) and N(D2CO)/N(H2CO) (bottom panel) column density ratios for our sources and for prestellar cores (Turner 2001; Bacmann et al. 2003; Chacón-Tanarro et al. 2019), low-mass protostars (Parise et al. 2006; Ceccarelli et al. 2014; Bianchi et al. 2017; Fontani et al. 2014; Manigand et al. 2020), and sources in the Orion region (Turner 1990; Parise et al. 2009). |
Acknowledgements
This paper makes use of the following ALMA data: ADS/JAO.ALMA#2017.1.01157.S. ALMA is a partnership of ESO (representing its member states), NSF (USA) and NINS (Japan), together with NRC (Canada), MOST and ASIAA (Taiwan), and KASI (Republic of Korea), in cooperation with the Republic of Chile. The Joint ALMA Observatory is operated by ESO, AUI/NRAO and NAOJ. This research was partially supported by the NAOJ ALMA Scientific Research Grant Number 2016-03B, the Italian Ministry of Education, Universities and Research through the grant Progetti Premiali 2012 iALMA (CUP C52I13000140001), the Deutsche Forschungsgemeinschaft (DFG, German Research Foundation) – Ref no. FOR 2634/1 TE 1024/1-1, the DFG cluster of excellence ORIGINS (www.origins-cluster.de), the EU Horizon2020 research and innovation programme, Marie Sklodowska-Curie grant agreement 823823 (Dustbusters RISE project), and the European Research Council (ERC) via the ERC Synergy Grant ECOGAL (grant 855130). Ke Wang acknowledges support by the National Key Research and Development Program of China (2017YFA0402702), the National Science Foundation of China (11721303), and the starting grant at the Kavli Institute for Astronomy and Astrophysics, Peking University (7101502016). I.J.-S. has received partial support from the Spanish FEDER (project number ESP2017-86582-C4-1-R) and the State Research Agency (AEI; project number PID2019-105552RB-C41).
Appendix A Observed H2CO, HDCO, and D2CO lines
In Table A.1 and we report the parameters derived fitting single or multiple velocity components to the detected lines with MADCUBA.
Fitted H2CO, H CO, HDCO, and D2CO excitation temperatures and column densities.
References
- Bacmann, A., Lefloch, B., Ceccarelli, C., et al. 2003, ApJ, 585, L55 [NASA ADS] [CrossRef] [EDP Sciences] [Google Scholar]
- Belitsky, V., Lapkin, I., Fredrixon, M., et al. 2018, A&A, 612, A23 [NASA ADS] [CrossRef] [EDP Sciences] [Google Scholar]
- Bergman, P., Parise, B., Liseau, R., & Larsson, B. 2011, A&A, 527, A39 [NASA ADS] [CrossRef] [EDP Sciences] [Google Scholar]
- Beuther, H., Churchwell, E. B., McKee, C. F., & Tan, J. C. 2007, Protostars and Planets V, 165 [Google Scholar]
- Bianchi, E., Codella, C., Ceccarelli, C., et al. 2017, MNRAS, 467, 3011 [NASA ADS] [CrossRef] [Google Scholar]
- Billade, B., Nystrom, O., Meledin, D., et al. 2012, IEEE Trans. Terahertz Sci. Technol., 2, 208 [NASA ADS] [CrossRef] [Google Scholar]
- Bovino, S., Grassi, T., Schleicher, D. R. G., & Caselli, P. 2017, ApJ, 849, L25 [CrossRef] [Google Scholar]
- Brown, P. D., & Millar, T. J. 1989a, MNRAS, 240, 25 [NASA ADS] [CrossRef] [EDP Sciences] [Google Scholar]
- Brown, P. D., & Millar, T. J. 1989b, MNRAS, 237, 661 [NASA ADS] [Google Scholar]
- Busquet, G., Palau, A., Estalella, R., et al. 2010, A&A, 517, L6 [NASA ADS] [CrossRef] [EDP Sciences] [Google Scholar]
- Caselli, P. 2002, Planet. Space Sci., 50, 1133 [NASA ADS] [CrossRef] [Google Scholar]
- Caselli, P., Walmsley, C. M., Tafalla, M., Dore, L., & Myers, P. C. 1999, ApJ, 523, L165 [Google Scholar]
- Caselli, P., Walmsley, C. M., Zucconi, A., et al. 2002, ApJ, 565, 344 [Google Scholar]
- Caselli, P., Vastel, C., Ceccarelli, C., et al. 2008, A&A, 492, 703 [NASA ADS] [CrossRef] [EDP Sciences] [Google Scholar]
- Ceccarelli, C., Caselli, P., Bockelée-Morvan, D., et al. 2014, Protostars and Planets VI, 859 [Google Scholar]
- Chacón-Tanarro, A., Caselli, P., Bizzocchi, L., et al. 2019, A&A, 622, A141 [NASA ADS] [CrossRef] [EDP Sciences] [Google Scholar]
- Crapsi, A., Caselli, P., Walmsley, C. M., et al. 2005, ApJ, 619, 379 [Google Scholar]
- Emprechtinger, M., Caselli, P., Volgenau, N. H., Stutzki, J., & Wiedner, M. C. 2009, A&A, 493, 89 [NASA ADS] [CrossRef] [EDP Sciences] [Google Scholar]
- Fontani, F., Palau, A., Caselli, P., et al. 2011, A&A, 529, L7 [NASA ADS] [CrossRef] [EDP Sciences] [Google Scholar]
- Fontani, F., Codella, C., Ceccarelli, C., et al. 2014, ApJ, 788, L43 [Google Scholar]
- Fontani, F., Busquet, G., Palau, A., et al. 2015, A&A, 575, A87 [NASA ADS] [CrossRef] [EDP Sciences] [Google Scholar]
- Fuente, A., Neri, R., & Caselli, P. 2005, A&A, 444, 481 [NASA ADS] [CrossRef] [EDP Sciences] [Google Scholar]
- Gerner, T., Beuther, H., Semenov, D., et al. 2014, A&A, 563, A97 [NASA ADS] [CrossRef] [EDP Sciences] [Google Scholar]
- Hsu, C.-J., Tan, J. C., Goodson, M. D., et al. 2021, MNRAS, 502, 1104 [Google Scholar]
- Iguchi, S., Morita, K.-I., Sugimoto, M., et al. 2009, PASJ, 61, 1 [CrossRef] [Google Scholar]
- Kong, S., Tan, J. C., Caselli, P., et al. 2017, ApJ, 834, 193 [NASA ADS] [CrossRef] [EDP Sciences] [Google Scholar]
- Körtgen, B., Bovino, S., Schleicher, D. R. G., et al. 2018, MNRAS, 478, 95 [Google Scholar]
- Manigand, S., Jørgensen, J. K., Calcutt, H., et al. 2020, A&A, 635, A48 [NASA ADS] [CrossRef] [EDP Sciences] [Google Scholar]
- Martín, S., Martín-Pintado, J., Blanco-Sánchez, C., et al. 2019, A&A, 631, A159 [NASA ADS] [CrossRef] [EDP Sciences] [Google Scholar]
- Milam, S. N., Savage, C., Brewster, M. A., Ziurys, L. M., & Wyckoff, S. 2005, ApJ, 634, 1126 [NASA ADS] [CrossRef] [Google Scholar]
- Müller, H. S. P., Schlöder, F., Stutzki, J., & Winnewisser, G. 2005, J. Mol. Struct., 742, 215 [Google Scholar]
- Parise, B., Ceccarelli, C., Tielens, A. G. G. M., et al. 2006, A&A, 453, 949 [NASA ADS] [CrossRef] [EDP Sciences] [Google Scholar]
- Parise, B., Leurini, S., Schilke, P., et al. 2009, A&A, 508, 737 [NASA ADS] [CrossRef] [EDP Sciences] [Google Scholar]
- Persson, M. V., Jørgensen, J. K., Müller, H. S. P., et al. 2018, A&A, 610, A54 [NASA ADS] [CrossRef] [EDP Sciences] [Google Scholar]
- Pety, J. 2005, in SF2A-2005: Semaine de l’Astrophysique Francaise, eds. F. Casoli, T. Contini, J. M. Hameury, & L. Pagani, 721 [Google Scholar]
- Roberts, H., & Millar, T. J. 2007, A&A, 471, 849 [NASA ADS] [CrossRef] [EDP Sciences] [Google Scholar]
- Rodgers, S. D., & Charnley, S. B. 2002, Planet. Space Sci., 50, 1125 [NASA ADS] [CrossRef] [Google Scholar]
- Roueff, E., & Lique, F. 2013, Chem. Rev., 113, 8906 [CrossRef] [PubMed] [Google Scholar]
- Roueff, E., Parise, B., & Herbst, E. 2007, A&A, 464, 245 [NASA ADS] [CrossRef] [EDP Sciences] [Google Scholar]
- Sakai, T., Sakai, N., Furuya, K., et al. 2012, ApJ, 747, 140 [NASA ADS] [CrossRef] [Google Scholar]
- Sakai, T., Yanagida, T., Furuya, K., et al. 2018, ApJ, 857, 35 [NASA ADS] [CrossRef] [Google Scholar]
- Salinas, V. N., Hogerheijde, M. R., Mathews, G. S., et al. 2017, A&A, 606, A125 [NASA ADS] [CrossRef] [EDP Sciences] [Google Scholar]
- Tan, J. C., Beltrán, M. T., Caselli, P., et al. 2014, Protostars and Planets VI, 149 [Google Scholar]
- Taquet, V., Ceccarelli, C., & Kahane, C. 2012, ApJ, 748, L3 [NASA ADS] [CrossRef] [Google Scholar]
- Tielens, A. G. G. M. 1983, A&A, 119, 177 [NASA ADS] [Google Scholar]
- Treviño-Morales, S. P., Pilleri, P., Fuente, A., et al. 2014, A&A, 569, A19 [NASA ADS] [CrossRef] [EDP Sciences] [Google Scholar]
- Turner, B. E. 1990, ApJ, 362, L29 [Google Scholar]
- Turner, B. E. 2001, ApJS, 136, 579 [Google Scholar]
- van der Wiel, M. H. D., Jacobsen, S. K., Jørgensen, J. K., et al. 2019, A&A, 626, A93 [NASA ADS] [CrossRef] [EDP Sciences] [Google Scholar]
- Watanabe, N. 2005, in IAU Symp., 231, Astrochemistry: Recent Successes and Current Challenges, eds. D. C. Lis, G. A. Blake, & E. Herbst, 415 [Google Scholar]
- Yamamoto, S. 2017, Introduction to Astrochemistry: Chemical Evolution from Interstellar Clouds to Star and Planet Formation [Google Scholar]
- Zahorecz, S., Jimenez-Serra, I., Testi, L., et al. 2017, A&A, 602, L3 [NASA ADS] [CrossRef] [EDP Sciences] [Google Scholar]
All Tables
Observed sources and their coordinates, LSR velocities, distances, kinetic temperatures, and 12C/13C ratio at the corresponding distance.
Targeted transitions and beam sizes, beam coupling efficiencies, and spectral resolution of our IRAM 30 m, APEX SEPIA, and ALMA Band 6 observations.
Fitted H2CO, H CO, HDCO, and D2CO excitation temperatures and column densities.
All Figures
|
Fig. 1 Spectra of the H2CO 30,3 − 20,2 and H |
| In the text | |
|
Fig. 2 213 GHz continuum maps towards G028-C1, G034-F2, G034-G2, 18089-1732, 18517+0437, G5.89-0.39, I19035-VLA1, and 19410+2336 (sorted by evolutionary stage). The black contours indicate the 3, 5, 10, and 15 σ levels of H |
| In the text | |
|
Fig. 3 Comparison of observed column density ratios of H2CO, HDCO, and D2CO. Upper limits are shown with red symbols. The arrow in the top panel indicates the increasing time from the HMSC phase towards the UC H II phase. |
| In the text | |
|
Fig. 4 Comparison of the observed N(D2CO)/N(H2CO) (top panel) and N(D2CO)/N(H2CO) (bottom panel) column density ratios for our sources and for prestellar cores (Turner 2001; Bacmann et al. 2003; Chacón-Tanarro et al. 2019), low-mass protostars (Parise et al. 2006; Ceccarelli et al. 2014; Bianchi et al. 2017; Fontani et al. 2014; Manigand et al. 2020), and sources in the Orion region (Turner 1990; Parise et al. 2009). |
| In the text | |
Current usage metrics show cumulative count of Article Views (full-text article views including HTML views, PDF and ePub downloads, according to the available data) and Abstracts Views on Vision4Press platform.
Data correspond to usage on the plateform after 2015. The current usage metrics is available 48-96 hours after online publication and is updated daily on week days.
Initial download of the metrics may take a while.