Fig. 1
Download original image
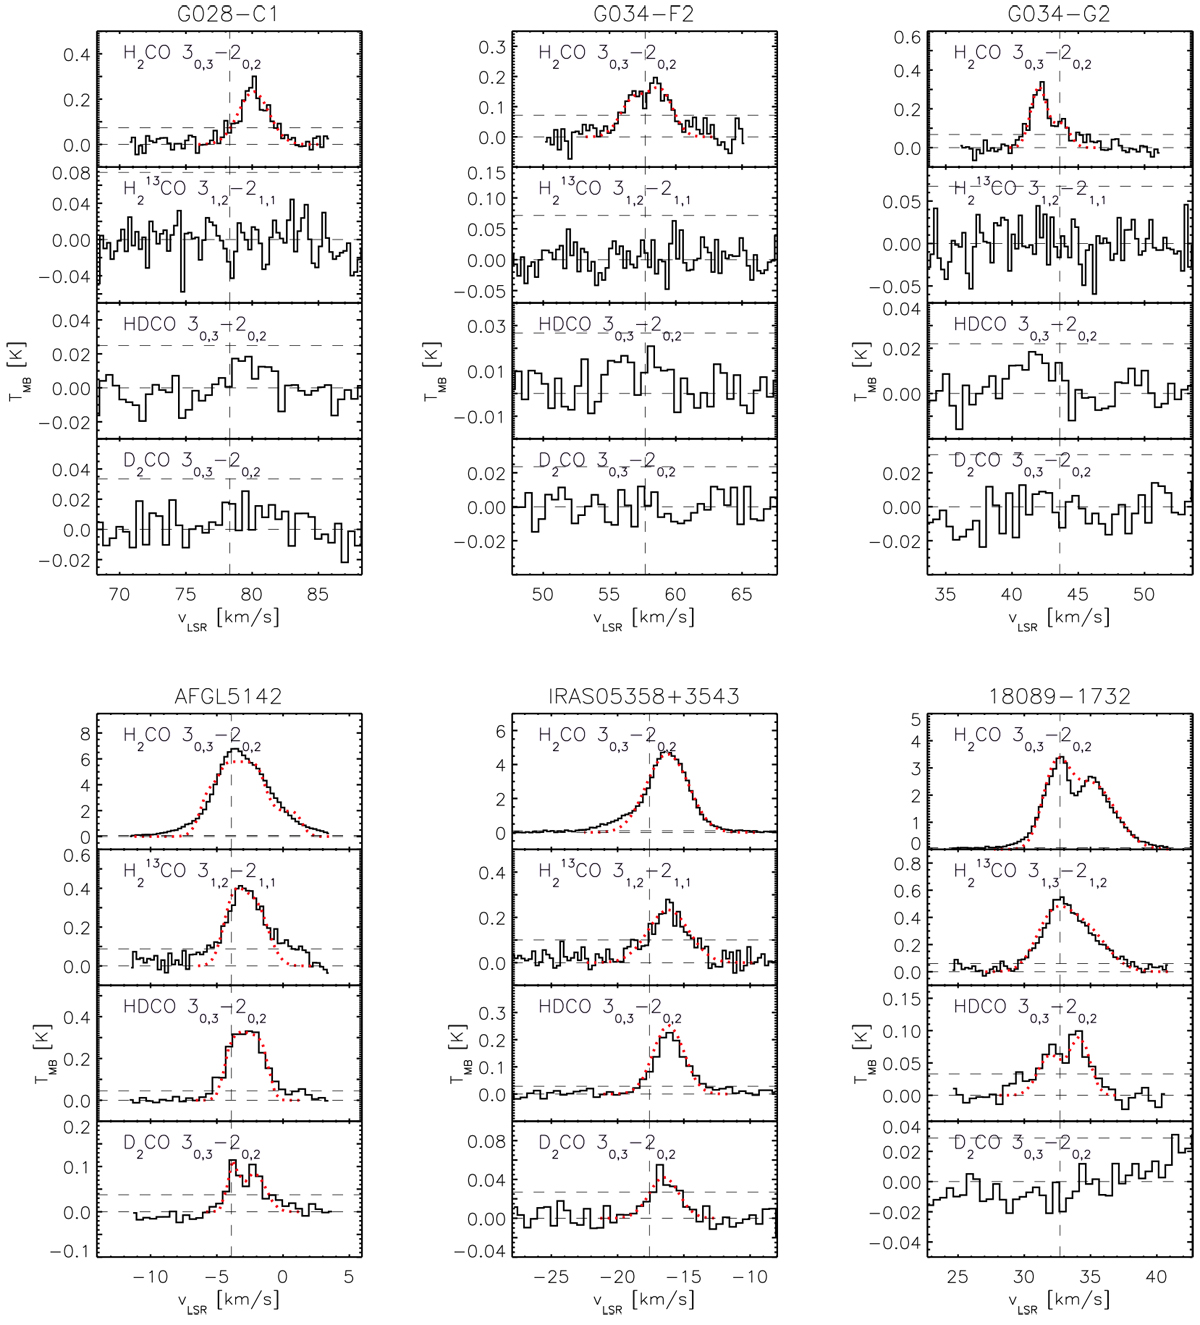
Spectra of the H2CO 30,3 − 20,2 and H![]() CO 31,2 − 21,1 lines (top two panels) observed with the IRAM 30 m telescope (Fontani et al. 2011, 2015) and HDCO 30,3 − 20,2 and D2CO 30,3 − 20,2 lines (bottom two panels) observed with APEX SEPIA Band 5 receiver (Zahorecz et al. 2017, and this work). Red lines indicate the fitted spectra. Horizontal lines indicate the TMB = 0 K and the 3 σ level. The vertical line indicates the VLSR for each source. The sources are sorted by the evolutionary stage; the order is the same as their order in Table 1.
CO 31,2 − 21,1 lines (top two panels) observed with the IRAM 30 m telescope (Fontani et al. 2011, 2015) and HDCO 30,3 − 20,2 and D2CO 30,3 − 20,2 lines (bottom two panels) observed with APEX SEPIA Band 5 receiver (Zahorecz et al. 2017, and this work). Red lines indicate the fitted spectra. Horizontal lines indicate the TMB = 0 K and the 3 σ level. The vertical line indicates the VLSR for each source. The sources are sorted by the evolutionary stage; the order is the same as their order in Table 1.
Current usage metrics show cumulative count of Article Views (full-text article views including HTML views, PDF and ePub downloads, according to the available data) and Abstracts Views on Vision4Press platform.
Data correspond to usage on the plateform after 2015. The current usage metrics is available 48-96 hours after online publication and is updated daily on week days.
Initial download of the metrics may take a while.