| Issue |
A&A
Volume 652, August 2021
|
|
|---|---|---|
| Article Number | L5 | |
| Number of page(s) | 2 | |
| Section | Letters to the Editor | |
| DOI | https://doi.org/10.1051/0004-6361/202141541 | |
| Published online | 04 August 2021 | |
Letter to the Editor
The unidentified infrared bands and the spectrum of atomic hydrogen
Fondation Louis de Broglie, 23 rue Marsoulan, 75012 Paris, France
e-mail: fzagury@wanadoo.fr
Received:
14
June
2021
Accepted:
20
July
2021
This letter compares the footprints on a spectral axis of the main unidentified infrared emission bands (UIBs) with the recombination lines of atomic hydrogen. The comparison shows striking correspondences, suggesting that atomic hydrogen may be involved in the production of UIBs.
Key words: ISM: lines and bands / ISM: general / astrochemistry
© ESO 2021
1. Introduction
Since the late 1960s excesses of infrared emission in the 3–12 μm wavelength range have been detected in all kinds of celestial environments, including planetary and reflexion nebulae, HII regions, high latitude cirrus, and galaxies. In the 1970s, these excesses were in part resolved into five unidentified infrared bands (UIBs) centered close to 3.3, 6.3, 7.7, 8.6, and 11.2 μm (Russell et al. 1978). Additional smaller emission bands have since been isolated, and it is commonly accepted that UIBs consist of multiple partially overlapping sub-components (Ricca et al. 2018, and references therein). UIBs peak in photo-dissociation frontier regions (Boulanger et al. 1998), in which neutral atomic hydrogen predominates. Their carrier(s) must be well mixed with interstellar gas and dust (Kahanpää et al. 2003, and references therein).
Four bands (UIBs 3.3, 6.6, 7.7, and 11.2) stand out in an overview of UIB spectra (Fig. 1 in Peeters et al. 2004). UIB 8.6 is the next most important as a red shoulder of UIB 7.7. The four main UIBs appear on top of three wave-like modulations (3.3–3.6 μm, 5–10 μm, and 10–14 μm) of the infrared excess continuum. Neither the bands nor the underlying continuum nor their interrelations are well understood.
With only a few exceptions UIB spectra from different sources superimpose well and therefore have similar imprints on the infrared spectrum. In the following sections I identify a strong correlation between the spectral imprints of UIBs and atomic hydrogen. This previously unnoticed relationship suggests the possible involvement of atomic hydrogen in the production of UIBs.
2. Unidentified infrared bands and the spectrum of atomic hydrogen
The 3.3–3.6 μm infrared excess region is bounded on its red side by UIB 3.3, the narrowest of the four main UIBs. UIB 3.3 occupies the 3.2–3.35 μm wavelength range (see for instance Fig. 1 of the following papers: Geballe 1997; van Diedenhoven et al. 2004; Tokunaga et al. 1991) and peaks close to Pfδ (Fig. 1) at the exact position of Humphrey’s series limit Hu∞ (λ = 3.282 μm). UIB 3.3 is generally observed in conjunction with hydrogen’s Brackett and Pfund recombination lines (Geballe 1997; Mori et al. 2012; Tokunaga et al. 1991). In the observations of Mori et al., the UIB disappears in directions where no hydrogen lines are detected. UIB 3.3 is followed by a not fully resolved series of sub-bands (Nagata et al. 1988) extending up to ∼3.6 μm. The whole 3.3–3.6 μm complex is thus bordered by Hu∞ on its blue side and covers the continuum of Humphrey transitions, as represented by the gray area on the left in Fig. 1.
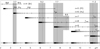 |
Fig. 1. UIBs and hydrogen recombination lines in the 2–12 μm wavelength range. Ticks on each horizontal line segment mark transitions Tp → n (calculated from Rydberg’s formula) from level p > n to level n for each n = 4, 5, ... 11. The bottom line gathers all hydrogen transitions between 2 and 12 μm. The ticks’ thickness is 0.01 μm. Moving from red to blue on each “n”-line, there is a quick convergence to a quasi-continuum of transitions from high Rydberg states, bordered on its blue side by T∞ → n. Shaded areas indicating the extent of UIBs are justified in the text. UIBs’ conventionally agreed upon central wavelengths are represented by vertical dotted lines. |
UIBs 6.3 and 11.2 have a similar shape that sometimes includes a small knee on its blue edge (Figs. 3a,b, Figs. 1 and 7, Figs. 3 and 4 in, respectively, Kahanpää et al. 2003; Peeters et al. 2002; van Diedenhoven et al. 2004). They run from slightly under 6–6.5 μm, and from under 11–11.8 μm. These features encompass the continua of hydrogen’s recombination lines to n = 8 and n = 11, respectively (Fig. 1).
The limits of UIB 7.7 are less certain because of the difficulties of disentangling the UIB from its red UIB 8.6 shoulder and fixing the continuum. In Fig. 2 of Peeters et al. (2002), the band ranges from ∼7.3 to ∼8.3 μm, as represented in Fig. 1. Mori et al. (2012) adopted a similar decomposition (their Fig. 4). The band’s spectral footprint covers hydrogen transitions to n = 9. In contrast to the previous bands, UIB 8.6 (8.3–8.9 μm) contains only a few discrete transitions.
The comparison of UIBs to hydrogen recombination lines undertaken thus far could be extended to longer wavelengths. The plateau described in Van Kerckhoven et al. (2000, Fig. 1) as occurring from shortly after 15 μm to slightly after 20 μm, which the authors interpret “as a collection of blended emission features”, exactly covers the continua of hydrogen transitions to n = 13 and n = 14.
3. Conclusion
The near- and mid-infrared spectrum of atomic hydrogen consists in discrete transitions that tend to stack up redward of transition limits T∞ → n (4 ≤ n ≤ 11). Merrill et al. (1975) and Geballe et al. (1985) independently noted a good match between the 3.3–3.6 μm infrared excess region and hydrogen’s Humphrey (n = 5) transitions, but both groups of scholars dismissed the existence of any correlation1. However, Fig. 1 shows a close relationship extending well beyond a single coincidence between hydrogen’s recombination spectrum from high Rydberg states and the spectrum of UIBs.
Up to the present the positions of UIBs on the spectrum have mainly been assigned to C–C and C–H stretches and C–H in and out of plane bends produced by polycyclic aromatic hydrocarbon (PAH) molecules (Peeters et al. 2002, 2004). But to date the lack of an exact match between PAH transitions and UIB positions on the spectrum has hampered the firm identification of any UIB carrier. The striking overlap of UIB imprints with the spectrum of hydrogen could, in this regard, impose new constraints on the search for the carrier(s) of UIBs. Among other carrier(s) that have been suggested in the literature, Rydberg matter (atoms or molecules, including hydrogen atoms, excited to high Rydberg states) proposed by Holmlid (2000) provides the closest match to the present finding.
Merrill et al. (1975) for instance argued that hydrogen transition Hu∞ would be “significantly larger than predicted by recombination theory”.
References
- Boulanger, F., Boissel, P., Cesarsky, D., & Ryter, C. 1998, A&A, 339, 194 [Google Scholar]
- Geballe, T. R. 1997, ASPCS, 122, 1997 [Google Scholar]
- Geballe, T. R., Lacy, J. H., Persson, S. E., et al. 1985, ApJ, 292, 500 [NASA ADS] [CrossRef] [Google Scholar]
- Holmlid, L. 2000, A&A, 358, 276 [NASA ADS] [Google Scholar]
- Kahanpää, J., Mattila, K., Lehtinen, K., et al. 2003, A&A, 405, 999 [NASA ADS] [CrossRef] [EDP Sciences] [Google Scholar]
- Merrill, K. M., Soifer, B. T., & Russell, R. W. 1975, ApJ, 200, L37 [CrossRef] [Google Scholar]
- Mori, T. I., Sakon, I., Onaka, T., et al. 2012, ApJ, 744, 68 [CrossRef] [Google Scholar]
- Nagata, T., Tokunaga, A. T., Sellgren, K., et al. 1988, ApJ, 326, 157 [NASA ADS] [CrossRef] [Google Scholar]
- Peeters, E., Hony, S., van Kerckhoven, C., et al. 2002, A&A, 390, 1089 [NASA ADS] [CrossRef] [EDP Sciences] [Google Scholar]
- Peeters, E., Allamandola, L. J., Hudgins, D. M., et al. 2004, ASPCS, 309, 141 [Google Scholar]
- Ricca, A., Bauschlicher, C. W., Jr, Roser, J. E., & Peeters, E. 2018, ApJ, 854, 115 [CrossRef] [Google Scholar]
- Russell, R. W., Soifer, B. T., & Willner, S. P. 1978, ApJ, 220, 568 [NASA ADS] [CrossRef] [Google Scholar]
- Tokunaga, A. T., Sellgreen, K., Smith, R. G., et al. 1991, ApJ, 380, 452 [NASA ADS] [CrossRef] [Google Scholar]
- van Diedenhoven, B., Peeters, E., Van Kerckhoven, C., et al. 2004, ApJ, 611, 928 [NASA ADS] [CrossRef] [Google Scholar]
- Van Kerckhoven, C., Hony, S., Peeters, E., et al. 2000, A&A, 357, 1013 [Google Scholar]
All Figures
|
Fig. 1. UIBs and hydrogen recombination lines in the 2–12 μm wavelength range. Ticks on each horizontal line segment mark transitions Tp → n (calculated from Rydberg’s formula) from level p > n to level n for each n = 4, 5, ... 11. The bottom line gathers all hydrogen transitions between 2 and 12 μm. The ticks’ thickness is 0.01 μm. Moving from red to blue on each “n”-line, there is a quick convergence to a quasi-continuum of transitions from high Rydberg states, bordered on its blue side by T∞ → n. Shaded areas indicating the extent of UIBs are justified in the text. UIBs’ conventionally agreed upon central wavelengths are represented by vertical dotted lines. |
| In the text | |
Current usage metrics show cumulative count of Article Views (full-text article views including HTML views, PDF and ePub downloads, according to the available data) and Abstracts Views on Vision4Press platform.
Data correspond to usage on the plateform after 2015. The current usage metrics is available 48-96 hours after online publication and is updated daily on week days.
Initial download of the metrics may take a while.