Fig. 1.
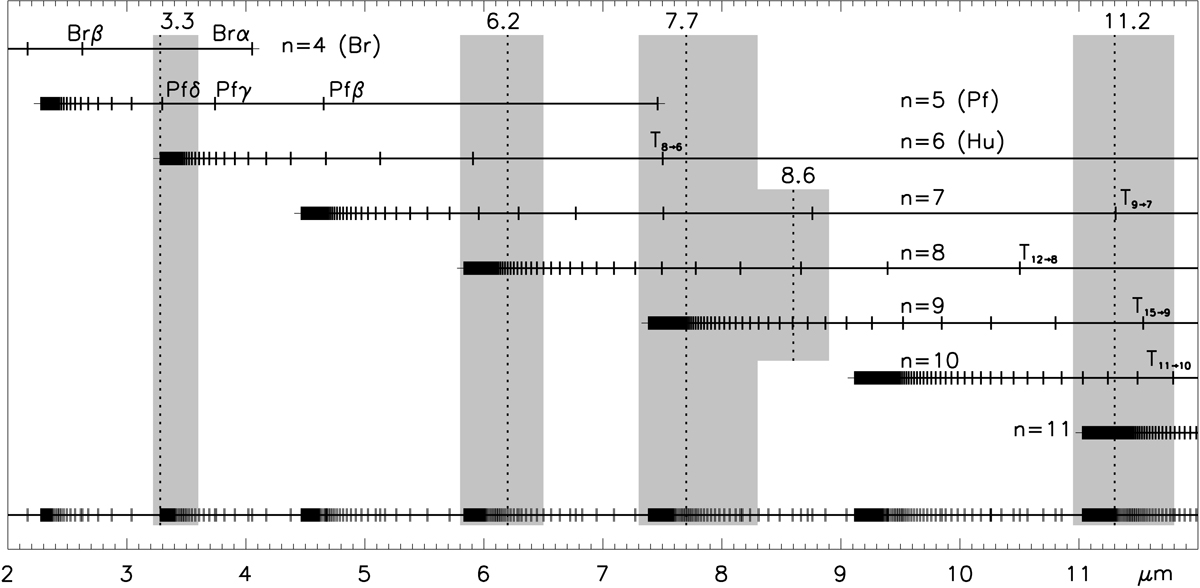
UIBs and hydrogen recombination lines in the 2–12 μm wavelength range. Ticks on each horizontal line segment mark transitions Tp → n (calculated from Rydberg’s formula) from level p > n to level n for each n = 4, 5, ... 11. The bottom line gathers all hydrogen transitions between 2 and 12 μm. The ticks’ thickness is 0.01 μm. Moving from red to blue on each “n”-line, there is a quick convergence to a quasi-continuum of transitions from high Rydberg states, bordered on its blue side by T∞ → n. Shaded areas indicating the extent of UIBs are justified in the text. UIBs’ conventionally agreed upon central wavelengths are represented by vertical dotted lines.
Current usage metrics show cumulative count of Article Views (full-text article views including HTML views, PDF and ePub downloads, according to the available data) and Abstracts Views on Vision4Press platform.
Data correspond to usage on the plateform after 2015. The current usage metrics is available 48-96 hours after online publication and is updated daily on week days.
Initial download of the metrics may take a while.