Fig. 5
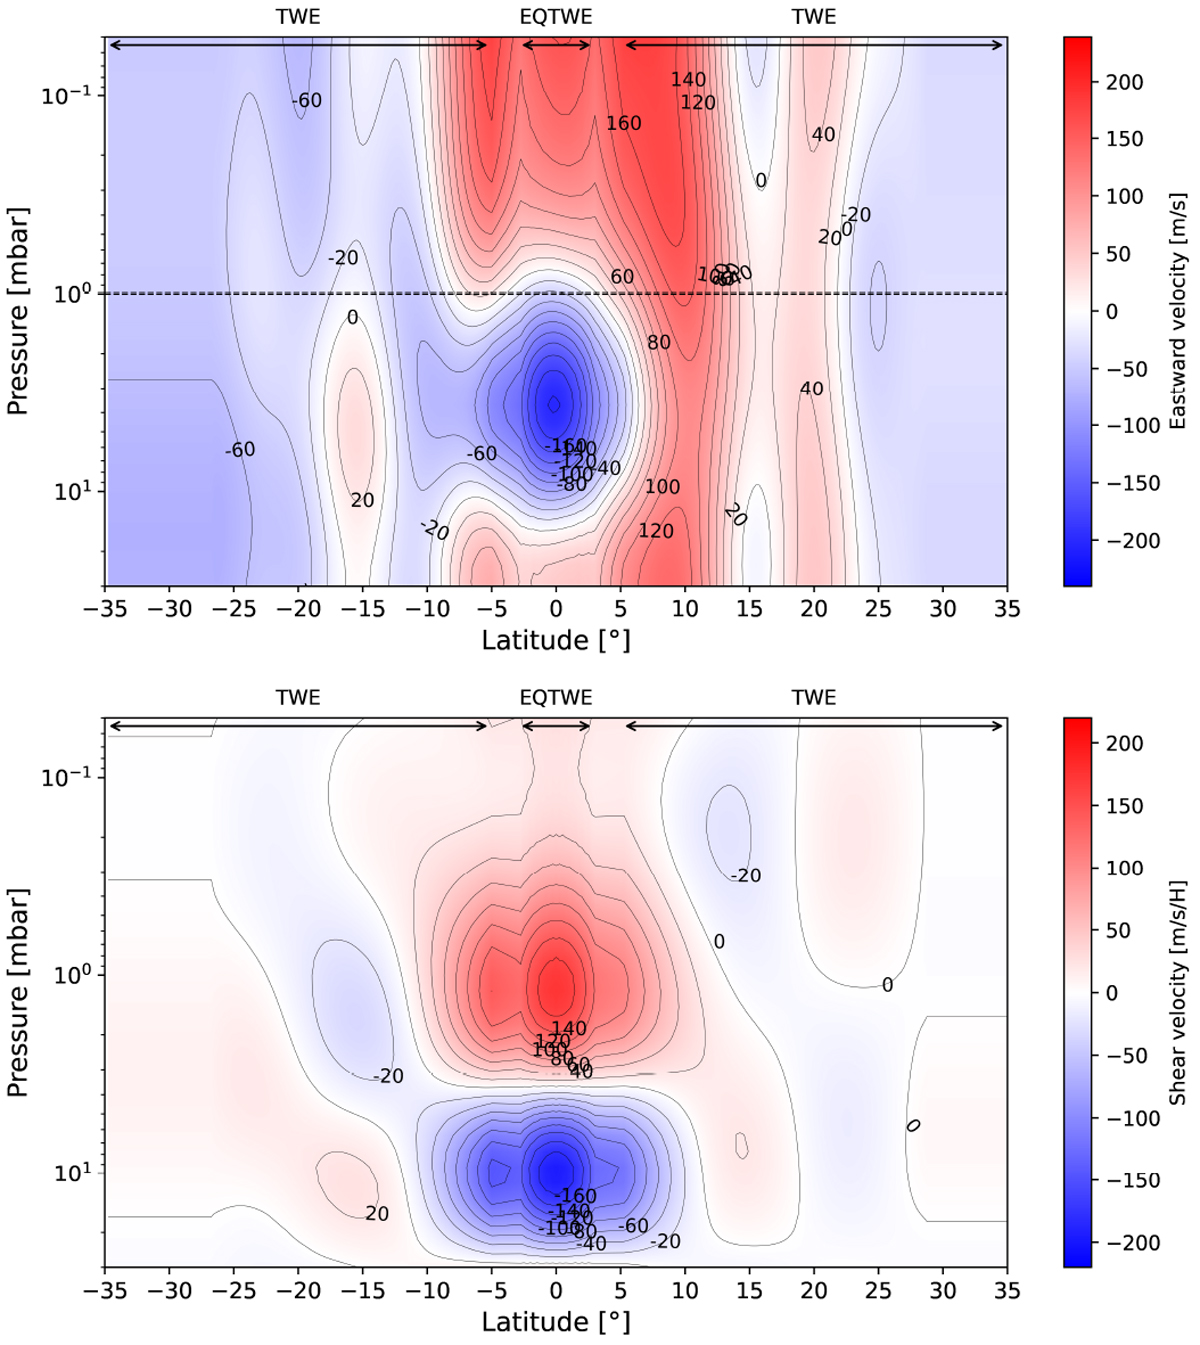
Top: eastward wind velocities derived from the east–west limb mean temperature map of Fig. 2 and the measured winds at 1 mbar of Fig. 3 with the EQTWE and TWE. The dashed horizontal line represents the altitude where stratospheric winds were measured by Cavalié et al. (2021). Bottom: wind shear as obtained from the east–west limb mean temperature field.
Current usage metrics show cumulative count of Article Views (full-text article views including HTML views, PDF and ePub downloads, according to the available data) and Abstracts Views on Vision4Press platform.
Data correspond to usage on the plateform after 2015. The current usage metrics is available 48-96 hours after online publication and is updated daily on week days.
Initial download of the metrics may take a while.