Fig. 4
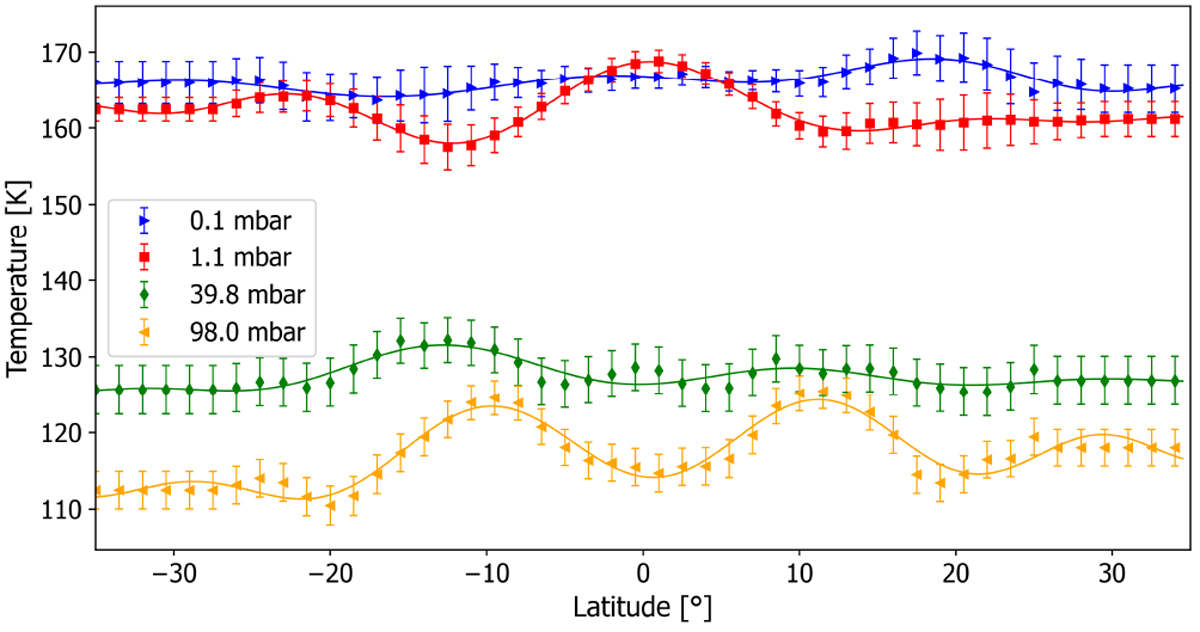
Examples of Legendre polynomial series fitting of the temperatures as a function of latitude for four different pressure levels. The two lower pressure profiles (0.1 and 1.1 mbar) are from the Giles et al. (2020) dataset that we primarily use in this paper. The higher pressure profiles (39.8 and 98 mbar) are from the Fletcher et al. (2020) dataset. Fits are in solid lines and data are shown with symbols and error bars of corresponding color.
Current usage metrics show cumulative count of Article Views (full-text article views including HTML views, PDF and ePub downloads, according to the available data) and Abstracts Views on Vision4Press platform.
Data correspond to usage on the plateform after 2015. The current usage metrics is available 48-96 hours after online publication and is updated daily on week days.
Initial download of the metrics may take a while.