Fig. 5.
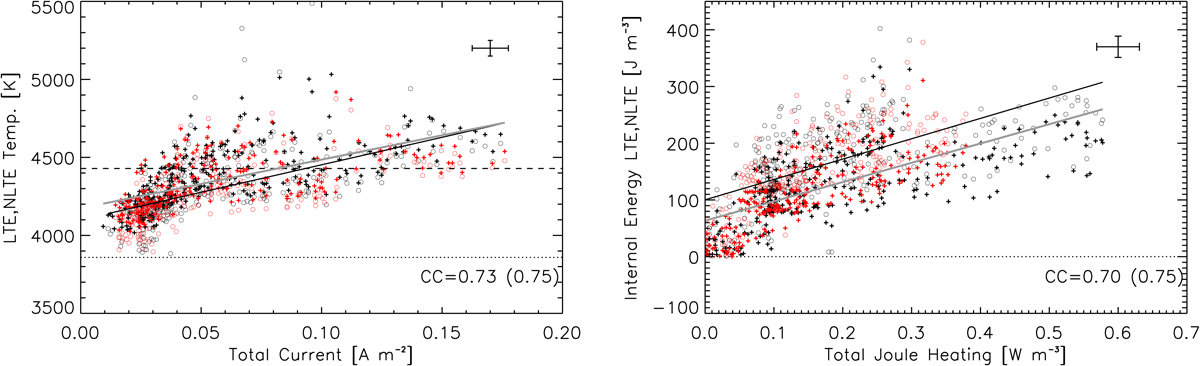
Correlation between currents and temperature enhancements as well as Joule heating and increase in internal energy in the LB. Left: scatter plots of |J| and temperature. The pluses and open circles correspond to the LTE and NLTE case, respectively. The red and black colors correspond to the data set at 20:48 UT and 21:00 UT, respectively. The solid black line and the grey line are a linear fit to the scatter in the NLTE and LTE case, respectively. The Spearman correlation coefficient for the NLTE case is shown in the lower right corner, while the LTE value is enclosed in parentheses. The dotted and dashed lines correspond to the average umbral and quiet Sun temperature, respectively. Right: scatter plots of Joule heating and internal energy. The mean error associated with the different parameters in the LB is shown in the top right corner of each panel.
Current usage metrics show cumulative count of Article Views (full-text article views including HTML views, PDF and ePub downloads, according to the available data) and Abstracts Views on Vision4Press platform.
Data correspond to usage on the plateform after 2015. The current usage metrics is available 48-96 hours after online publication and is updated daily on week days.
Initial download of the metrics may take a while.