Fig. 4.
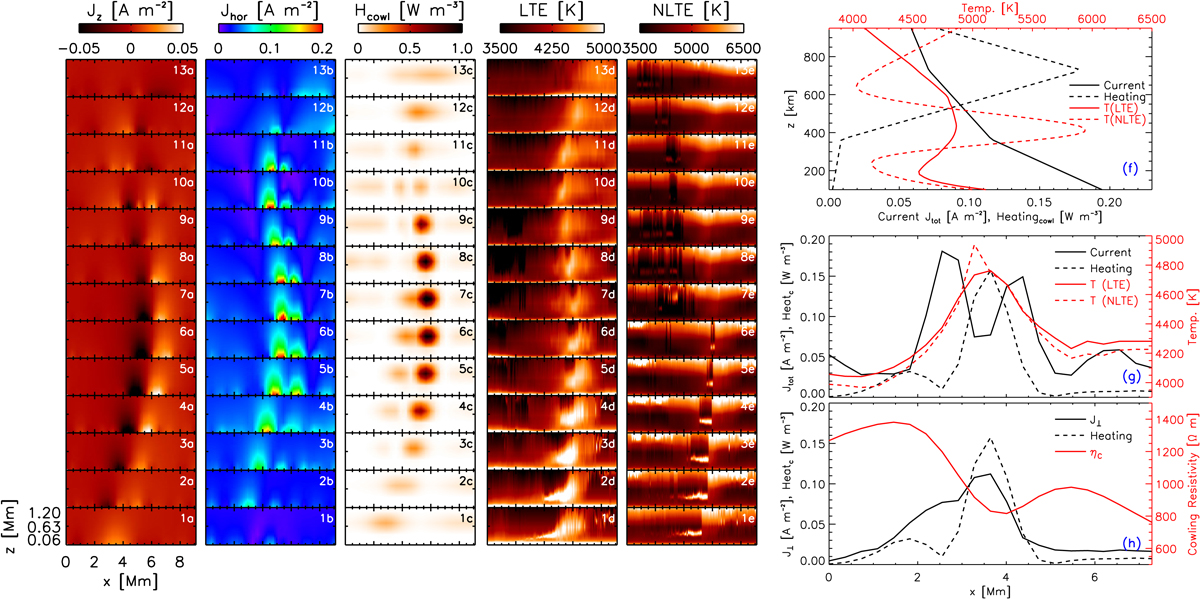
Vertical variation in physical parameters at different positions on the spine of the LB. Columns a–e: 2D slices of the currents Jz and Jhor, Joule heating by Cowling resistivity, LTE temperature T, and NLTE temperature T (left to right) for the horizontal cuts across the LB (panel 2b in Fig. 2). Panel f: vertical distribution of parameters at the center of the LB at the white horizontal cut shown in Fig. 2b. The heating term has been scaled down by a factor of five. Panel g: horizontal variation in parameters along the same cut after temperature, current, and heating were averaged in height. The heating term has been reduced by a factor of two. Panel h: same as above but for J⊥, ηC, and the Joule heating. J⊥ has been scaled up by a factor of three.
Current usage metrics show cumulative count of Article Views (full-text article views including HTML views, PDF and ePub downloads, according to the available data) and Abstracts Views on Vision4Press platform.
Data correspond to usage on the plateform after 2015. The current usage metrics is available 48-96 hours after online publication and is updated daily on week days.
Initial download of the metrics may take a while.